The Business Model of Nostalgia
Nintendo Business Analysis · 2026
This is a deep dive into Nintendo’s business. The first five sections will aim to build a strong foundational understanding of the business model, the competitive landscape, how Nintendo actually makes money, and what the financial statements tell us about the quality of the business. The remain sections will take closer look at the business from an investment perspective to cover the moat, the risks, management quality, and valuation, including a reverse DCF and a base-case model.
Table of Contents
- Business Overview
- Business Quality Assessment
- Balance Sheet Health
- Moat Analysis
- Risk Framework
- Management & Capital Allocation
- Valuation
- Investment Judgement
1. Business Overview
The Business In Plain Language
Nintendo owns and monetizes a multi-decade library of light-hearted entertainment IP - Mario, Zelda, Pokémon - primarily through a closed hardware-software ecosystem where proprietary consoles and exclusive games function as a reinforcing flywheel. The current platform, Nintendo Switch 2, is a hybrid device which functions as a home console when docked to a TV and a handheld when carried around. The Switch 2 launched in June 2025 and had sold 19.86 million units by the close of fiscal 2026 (March 31, 2026), making it the fastest-selling console in the company’s history1. Unlike Sony or Microsoft, Nintendo’s consoles do not chase raw computing power. Nintendo focuses on console form factors that create unique gaming experiences and couple this with their beloved library of characters that either a five-year-old or a fifty-year-old can both enjoy on the same device.
Unit economics of the business are largely unchanged in the 50+ years that Nintendo has operated in the console gaming space. Hardware is sold at breakeven or a modest profit, with in-house developed software sold at gross margins that can exceed 80%2.
In recent years a new revenue surface has been added: transmedia monetization. The Super Mario Bros. Movie (2023) grossed over $1.3 billion3. The sequel, The Super Mario Galaxy Movie, has already crossed roughly $1 billion in 20264. Super Nintendo World theme park zones operate inside Universal Studios parks in Osaka and Hollywood, with Orlando and Singapore in the pipeline. These do not currently move revenue needle materially yet. IP-related licensing income was roughly 3% of sales in fiscal 20265. But it is high-margin, capital-light (Universal builds and operates the parks; Nintendo licenses the IP), and it extends the franchise’s cultural relevance to audiences who may have never owned a console, which is particularly relevant to Nintendo’s expansion into new markets.
Customer Groups
In 2021, Nintendo shared age-distribution data for active accounts. The message was that the customer base is far more diversified than you might expect.
Nintendo Age Distribution, 20236
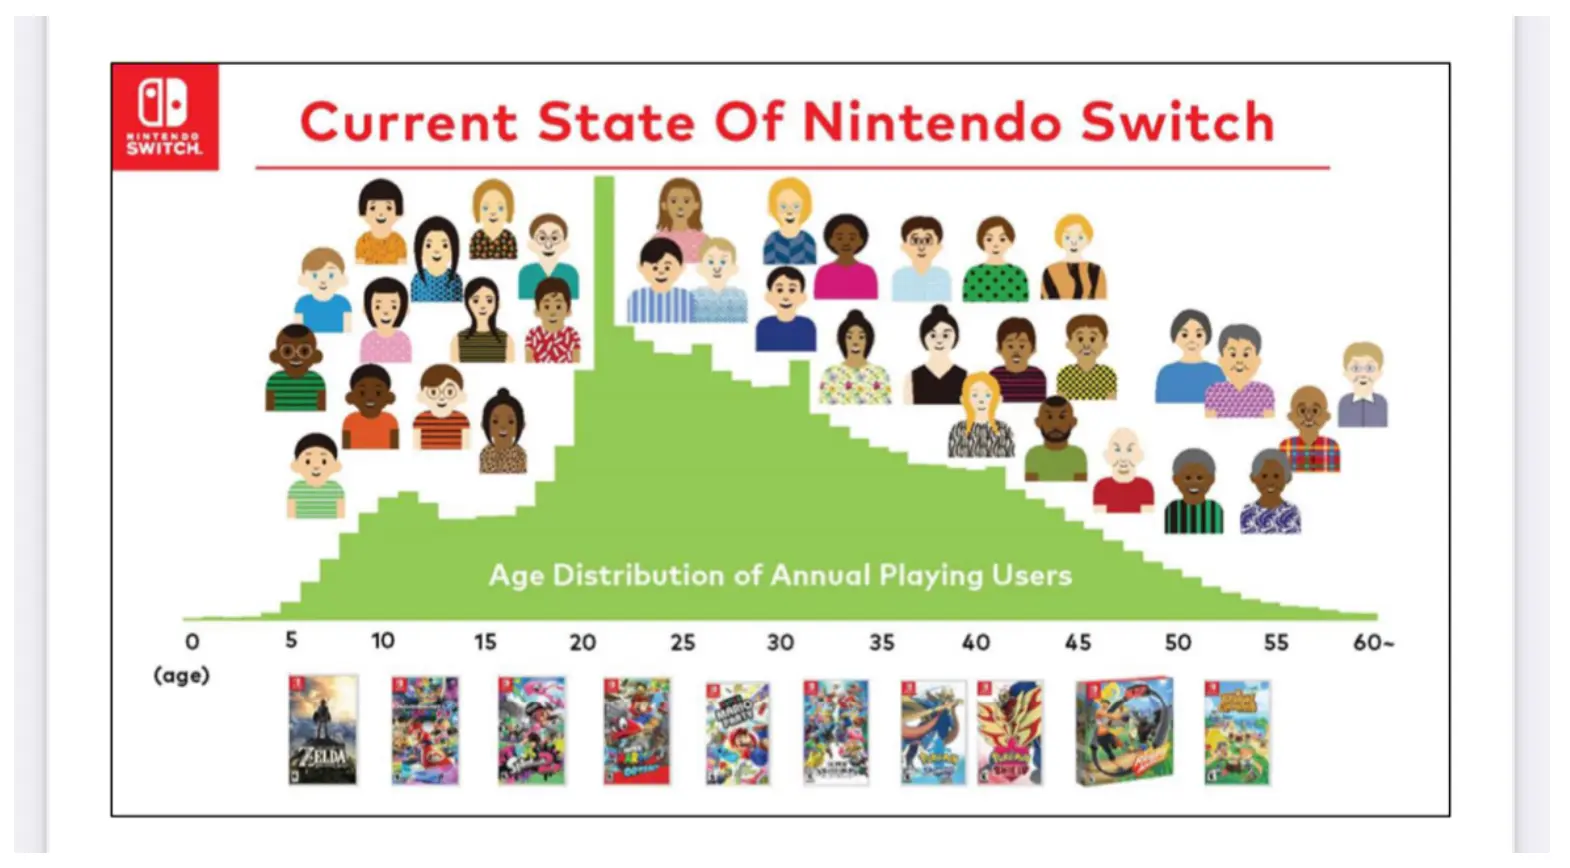
The caveat: how many of the 30+ cohort are actually parents making accounts for their under-15 children? My own view, based on conversations with people in the space, real-life observation, and Pokémon card market trends is that there is probably a lot of children in that “adult” bucket.
Regardless, the wide range of age cohorts implies that Nintendo experiences two distinct buyer/user relationships.
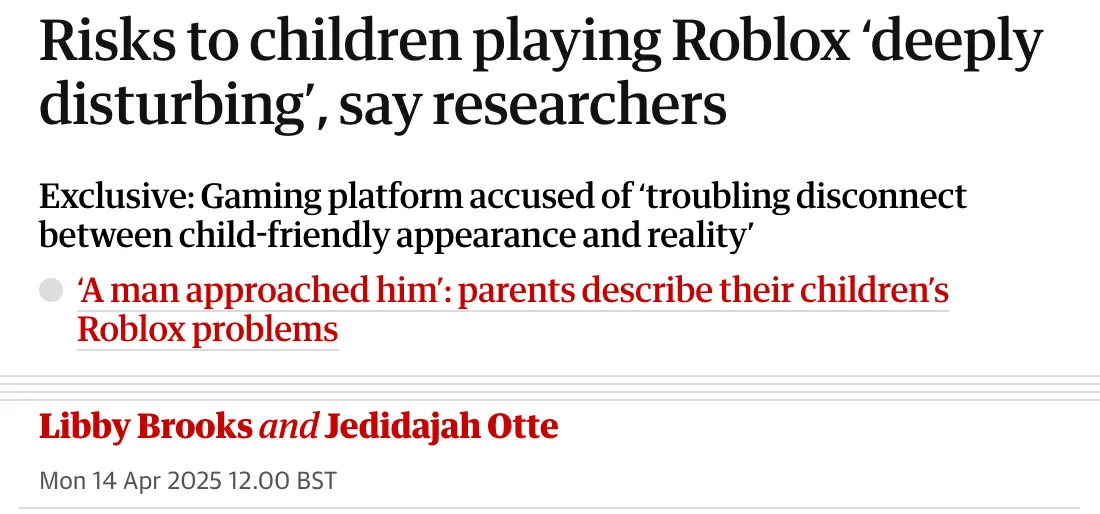
The Parent/Child Relationship A parent or grandparent purchasing for a child is a meaningfully different dynamic than Sony or Microsoft’s core demographic of adult gamers buying for themselves. This has historically made Nintendo’s install base more resilient to discounting and recessions (gift-giving and family entertainment budgets are more stable than discretionary adult hobby spend) but also means Nintendo must balance the desires of two audiences simultaneously. Games must pass the parent’s safety and quality-check, and be fun enough that the child actually wants to play it. Over decades, that is a finer line to walk than it may seem at first glance. Roblox, a newer gaming platform, for comparison, faces real parental skepticism early in its lifecycle due to child safety concerns.
Roblox Faces Real Safety Concerns Among Parents7
The Adult Gamer The second customer relationship is the adult gamer who is purchasing the console and games for themselves. It is likely that the majority of this cohort are nostalgia-driven gamers who played Nintendo games in their childhood and are seeking to re-experience their favourite characters and games in adult years. This implies another trade-off Nintendo must balance in their products: games must be fun for both adults and children. This is again more difficult than it appears on first glance as games must find an equilibrium between difficulty, complexity and attention-span that works for vastly different levels of mental development.
Market Structure
According to NewZoo research, the global gaming industry represents approximately $200B USD in global sales, sourced from ~4.5B gamers. Almost half of these dollars come from the Asia-pacific region, with North America and Europe producing the majority of the remaining 50%. The Middle East, Africa and Latin America only represent ~9% of global revenues.8
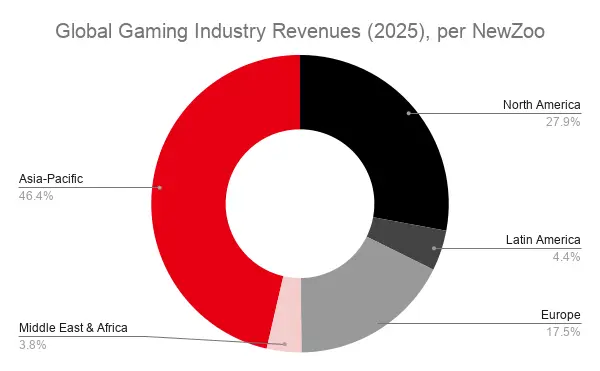
In FY26, Nintendo’s video game platform revenue was ~14B USD9 and active player count was ~130M10. This implies that even with decades of history, the business remains materially under-penetrated in the wider market.
Nintendo’s reported revenue by geography illustrates how the business is over-indexed on North America and Europe relative to the industry overall, while Asia-Pacific remains under-penetrated. China has historically been, and is expected to remain, limited to Nintendo’s business as operating in China requires compliance with CCP standards that make it difficult for consoles games to compete with PC and mobile gaming11.
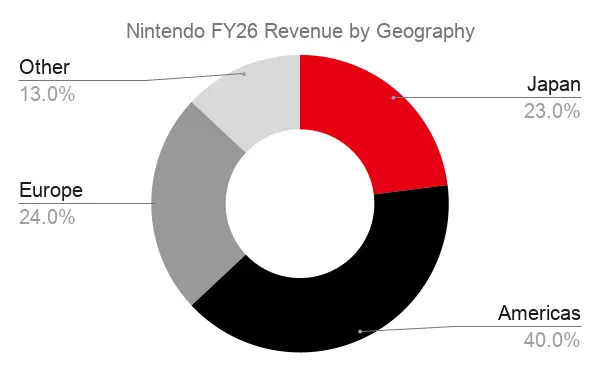
Revenue by geography (FY26):
| Region | % of Revenue | YoY (Switch 2 launch) | Switch 1 Period CAGR |
|---|---|---|---|
| Americas | 40% | +81% | 12% |
| Japan | 23% | +96% | 10% |
| Europe | 24% | +93% | 10% |
| Rest of World | 13% | +291% | 17% |
At the same time, Nintendo generates less than 40% of revenue from any single continent. It is a genuinely diversified user base that provides a natural hedge against macro shocks like tariffs or supply chain disruption. Currency and foreign exchange gains/losses are a real factor given USD-denominated earnings exposure. The Switch 2 launch was disproportionately strong in Rest-of-World, hinting at software attach potential above and beyond what Switch 1 delivered in those markets.
Console Gaming
Global Gaming Revenues by Platform
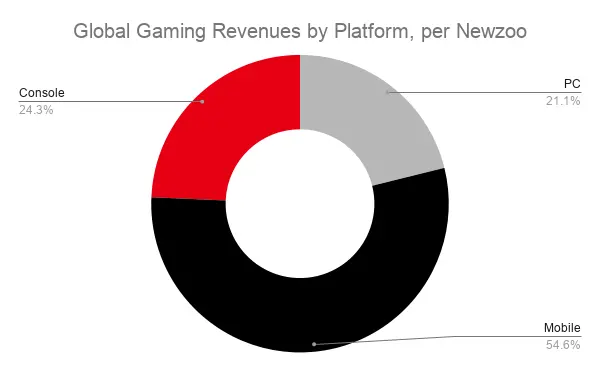
While the console market experienced rapid growth during the pandemic, in 2026, the console market is now mature and slow-growing. By the end of the decade, consoles will likely be the smallest gaming platform by player growth:
- PC players: forecast 3.1% CAGR (2025–2028), accelerating vs. 2022–2025
- Console players: 2.5% — the slowest-growing platform, largely saturated in key markets
- Mobile players: 4.5% — fastest-growing, driven by the Middle East, North Africa, and Southeast Asia
The slowing growth of the market puts pressure on market participants, which has historically been dominated by three key players: Nintendo (Switch), Sony (Playstation), and Microsoft (Xbox). However, since 2013 Microsoft has been slowly losing marketshare to Sony after several strategic bets failed to pay off including the Kinect motion control system and Xbox Game Pass subscription platform. In fact, Microsoft has ceased to disclose hardware unit sales entirely. While that makes it difficult to estimate marketshare, it is an indicator that the hyper-scaler may be shifting its focus away from the living-room hardware race and is pursuing a gaming software subscription strategy. In 2025 Xbox announced that many of it’s hit exclusive titles would be available on Playstation as part of a subscription service, adding credence to the idea that they are pulling out of the console hardware race.
This is a highly significant event as it leaves just Nintendo and Sony as the two companies still meaningfully competing on dedicated hardware, with Nintendo owning the family/value segment and Sony owning the premium/core-gamer segment. We will look at this in more depth below, however, this benefits Nintendo as it is, in my opinion, more likely that Nintendo is able to capture share from Sony than the other way around, due to the increased power of the Switch 2, its portable form factor and the exclusive IP on the Switch platform.
A newer segment of the console market has opened: Valve’s “Steam Deck” and the ROG “Ally” are creating portable PC gaming devices, moving into the category Nintendo effectively invented with the original Switch. These are still more likely to compete with Sony’s player base, rather than Nintendo’s, again, due to the exclusivity of Nintendo’s IP.
Revenue Model
Nintendo has 3-5 revenue streams, depending on how you split the products. I have split them into 4 groups based on the data reported in their investor package, as these groups allow for back-calculation of several metrics in later sections of the report.
In order of size:
1. Console hardware (~40–60% of revenue).
Unlike other console makers, who’s consoles serve as loss-leaders for the games, Nintendo actually makes money on hardware. This is part of the cultural philosophy of the business and goes back to company roots.
2. First-party software, physical + digital (~25–50% of revenue).
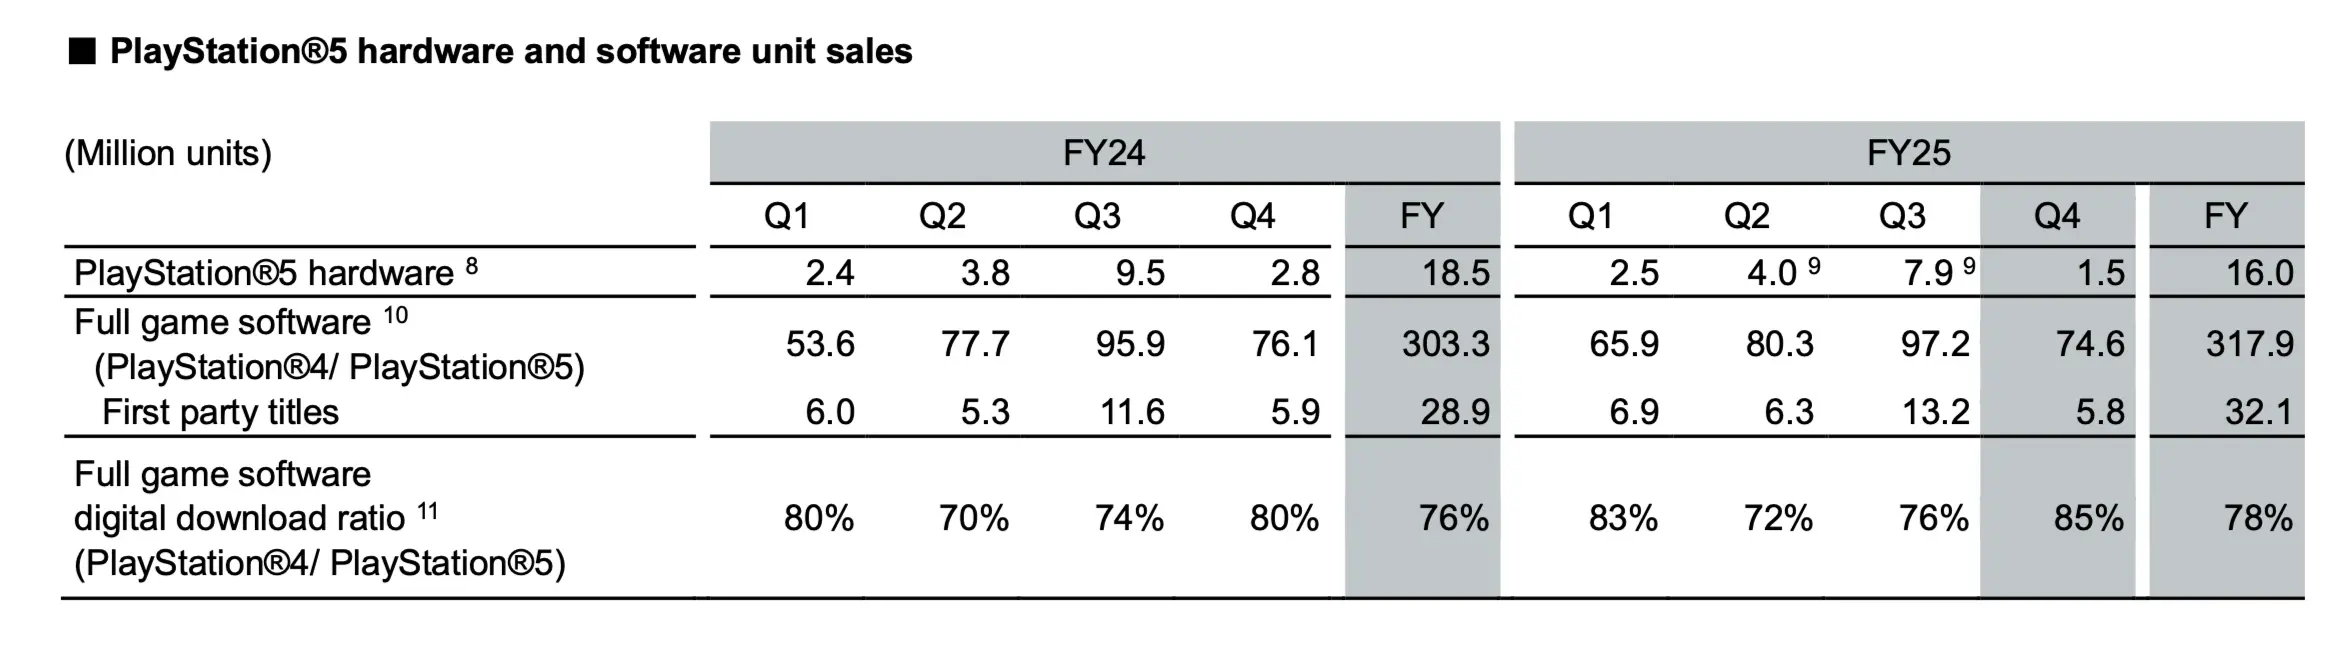
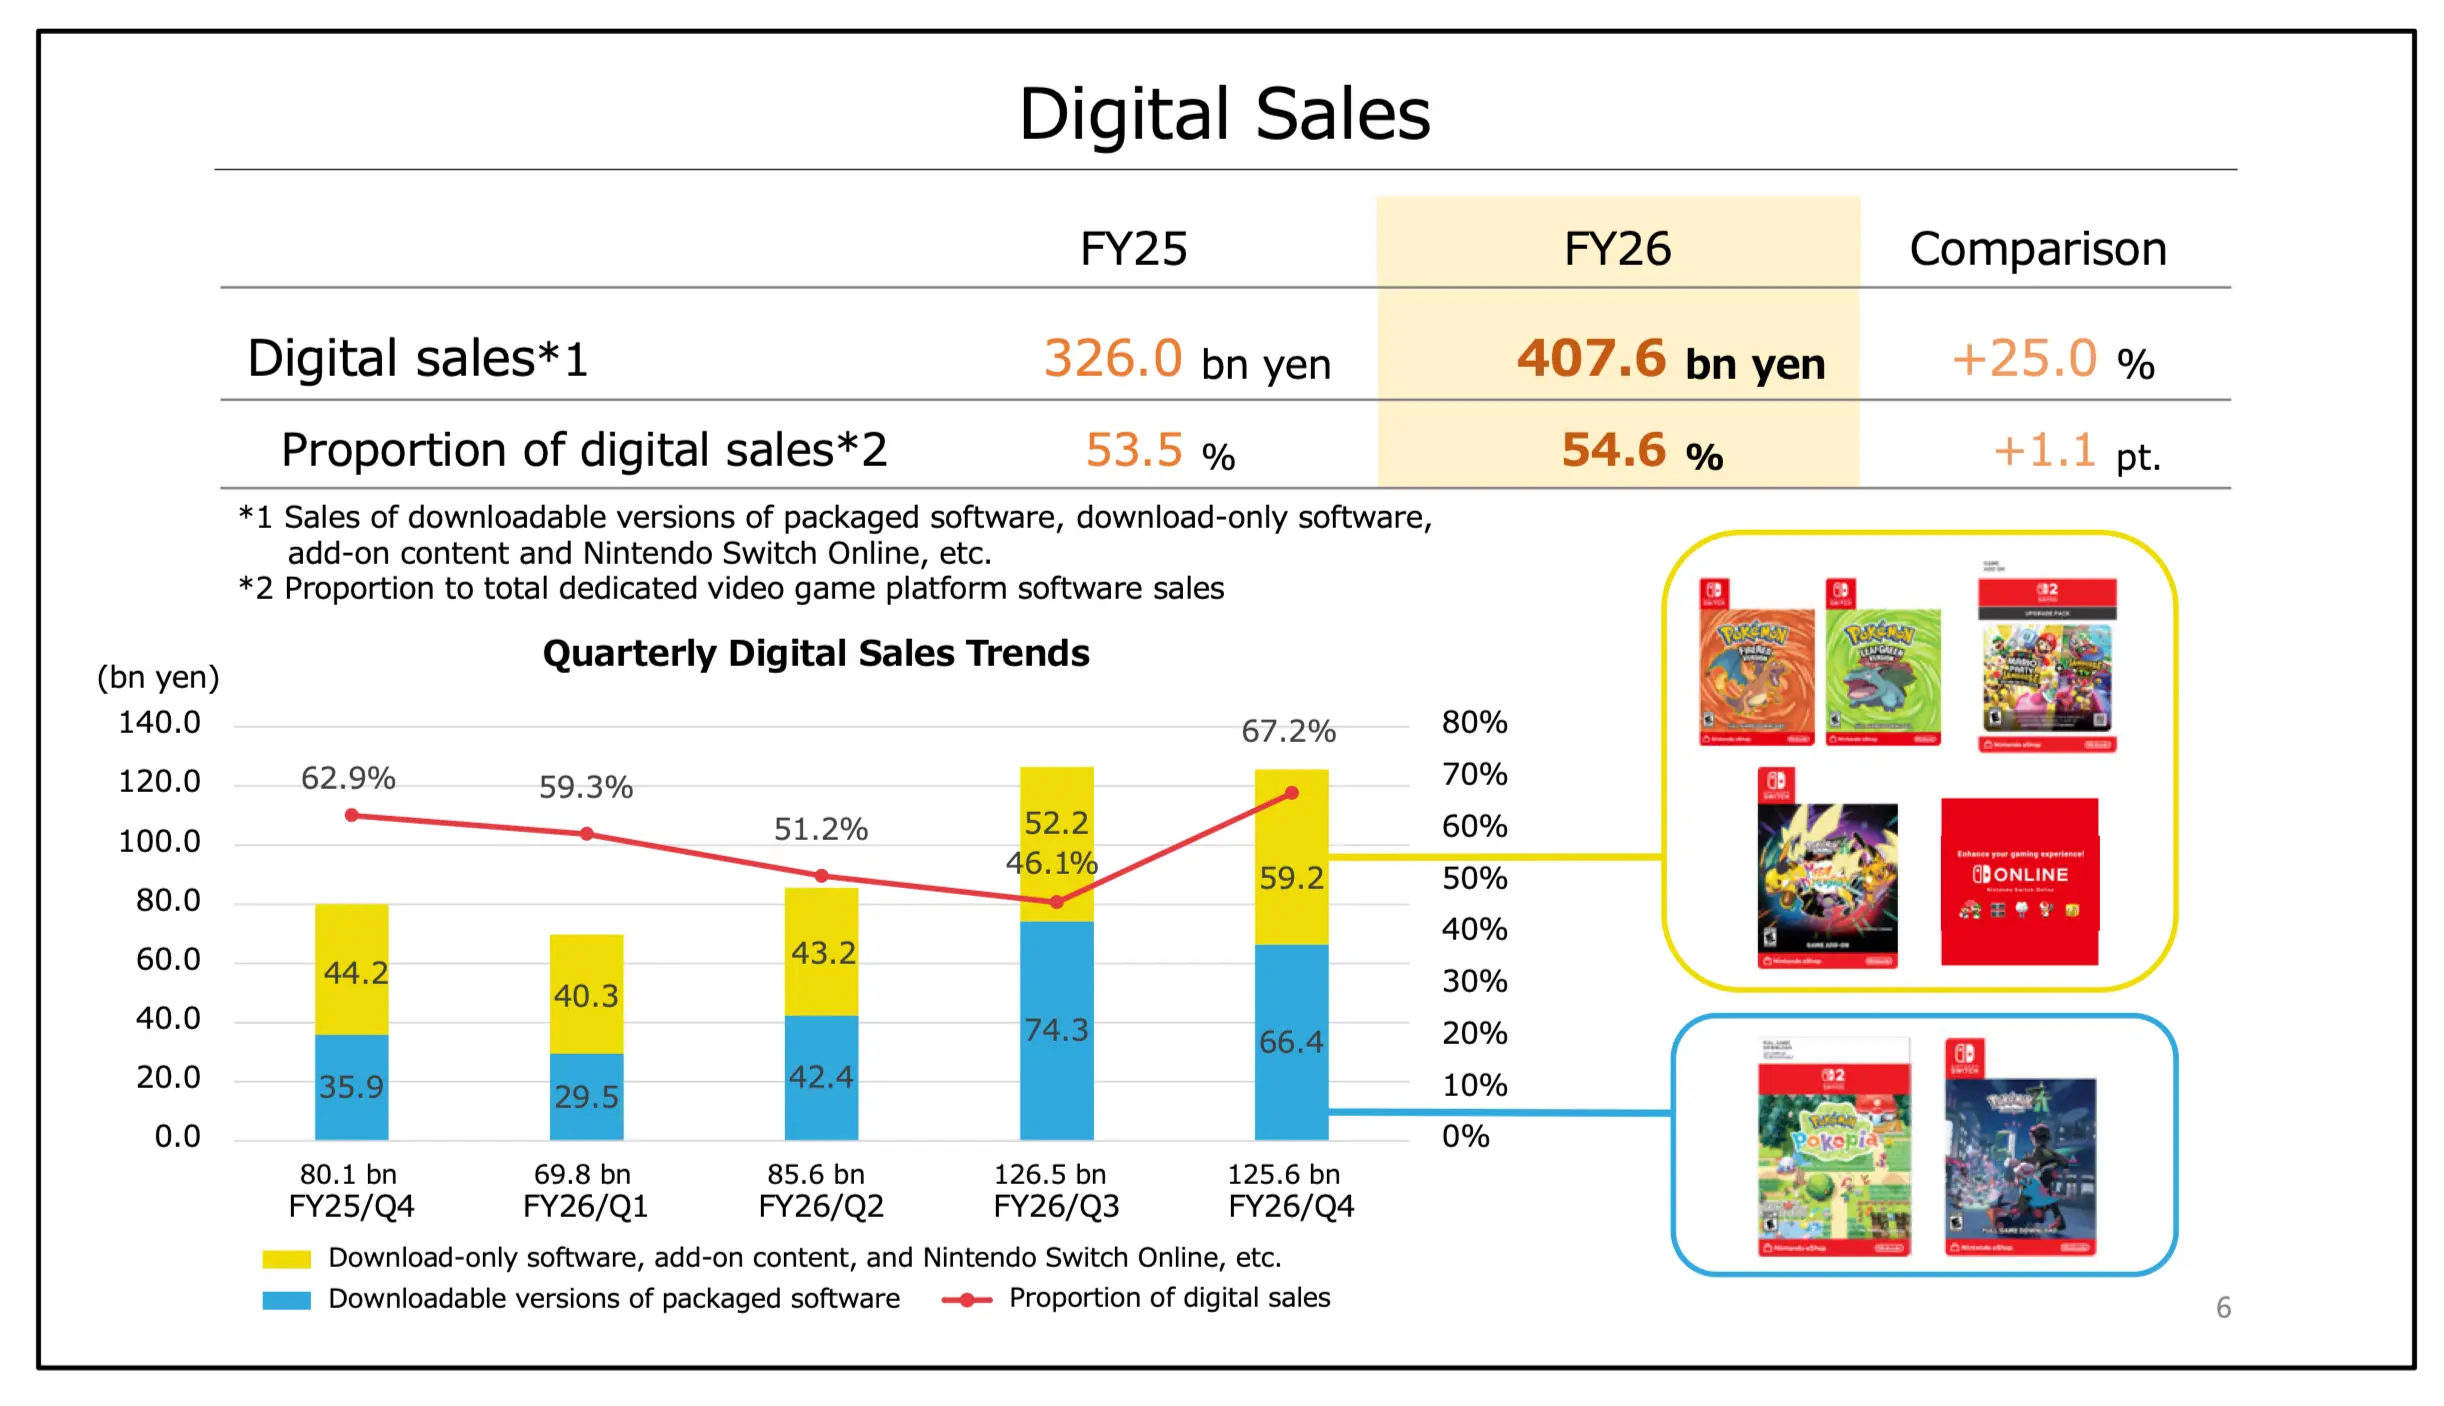
The engine and cash cow for the business. First-party titles carry ~80%+ gross margins. Digital sales mix still lags meaningfully behind competitors, providing opportunity for further improvement in the profitability of the segment.
Sony’s reported digital mix:12
Nintendo’s reported digital mix:13
3. Third-party software & Nintendo Switch Online (~8–10% of revenue).
Approximately 34M+ active Nintendo accounts are subscribed to Nintendo Switch Online services. This pass allows access to a deep library of retro games, modern game expansion packs, and online gameplay.
Nintendo Switch Online Features:14
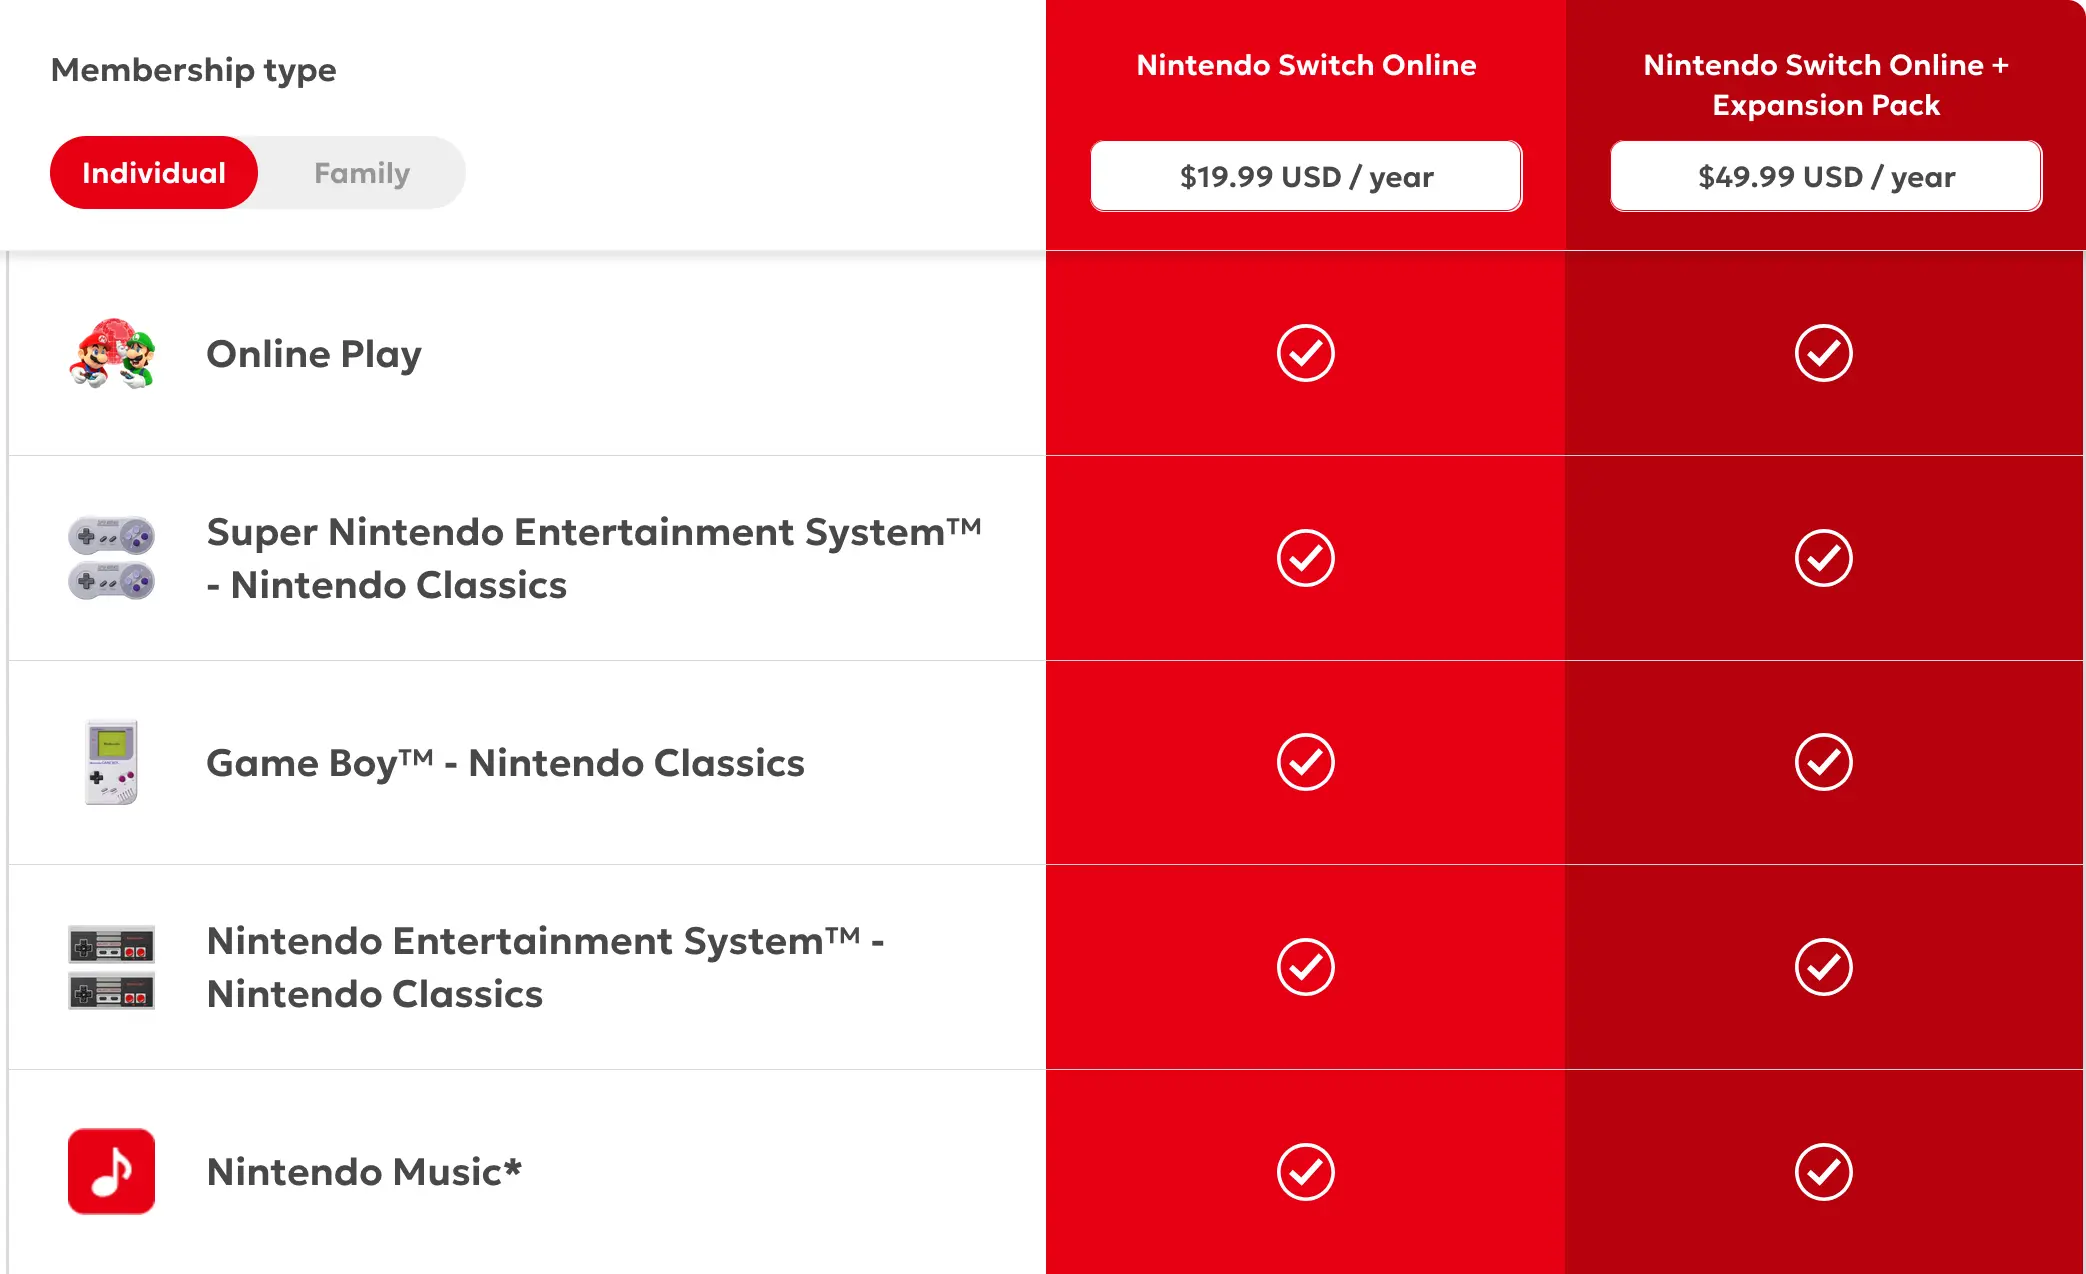
34M million subscribers represents only ~26% of active Nintendo accounts. Playstation’s mix is closer to 40%. However, this may not be an apples-to-apples comparison since the Playstation demographic skews older and more competitive, increasing the likelihood for online service desirability.
Sony Playstation Plus Subscriber Mix15
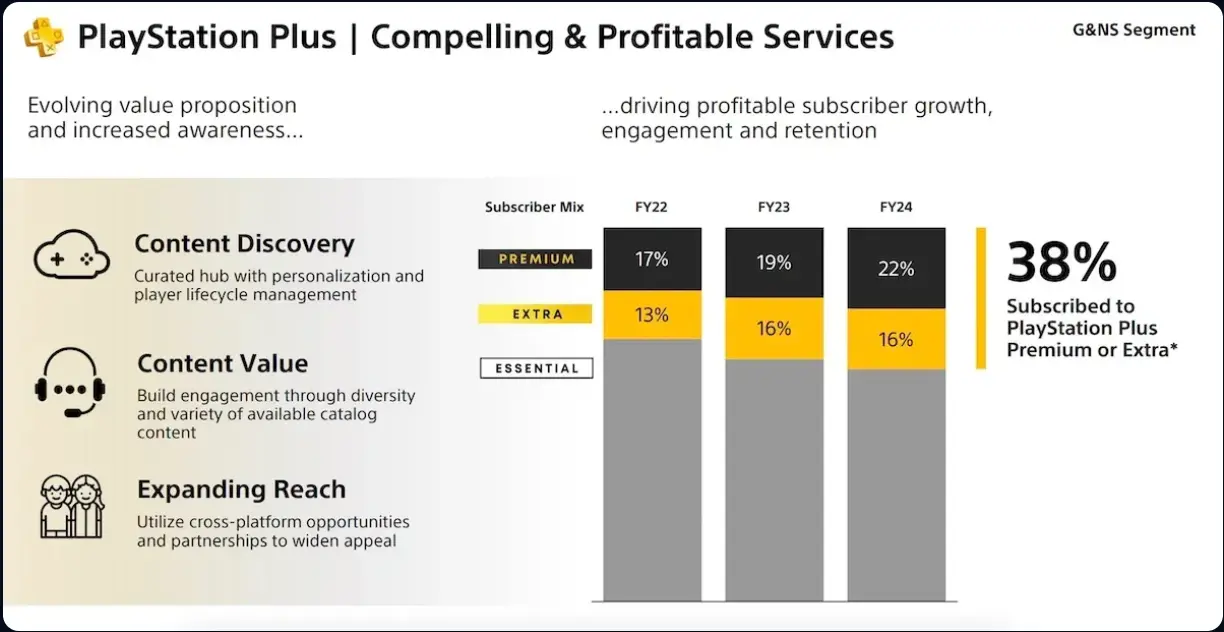
The other important item to note in regards to NSO is the difference in pricing between the tiers. While the lower tier is only $20 USD per month, the higher tier option is $50. Given there is essentially zero marginal cost difference between the two tiers, it is more profitable for Nintendo to move a base tier subscriber to the higher tier, than it is to gain a new base tier subscriber. If Nintendo is able to continuous add value to the expansion tier, such as through restricted access to additional game content, the profitability of the segment will increase dramatically, without needing to grow the current subscriber base.
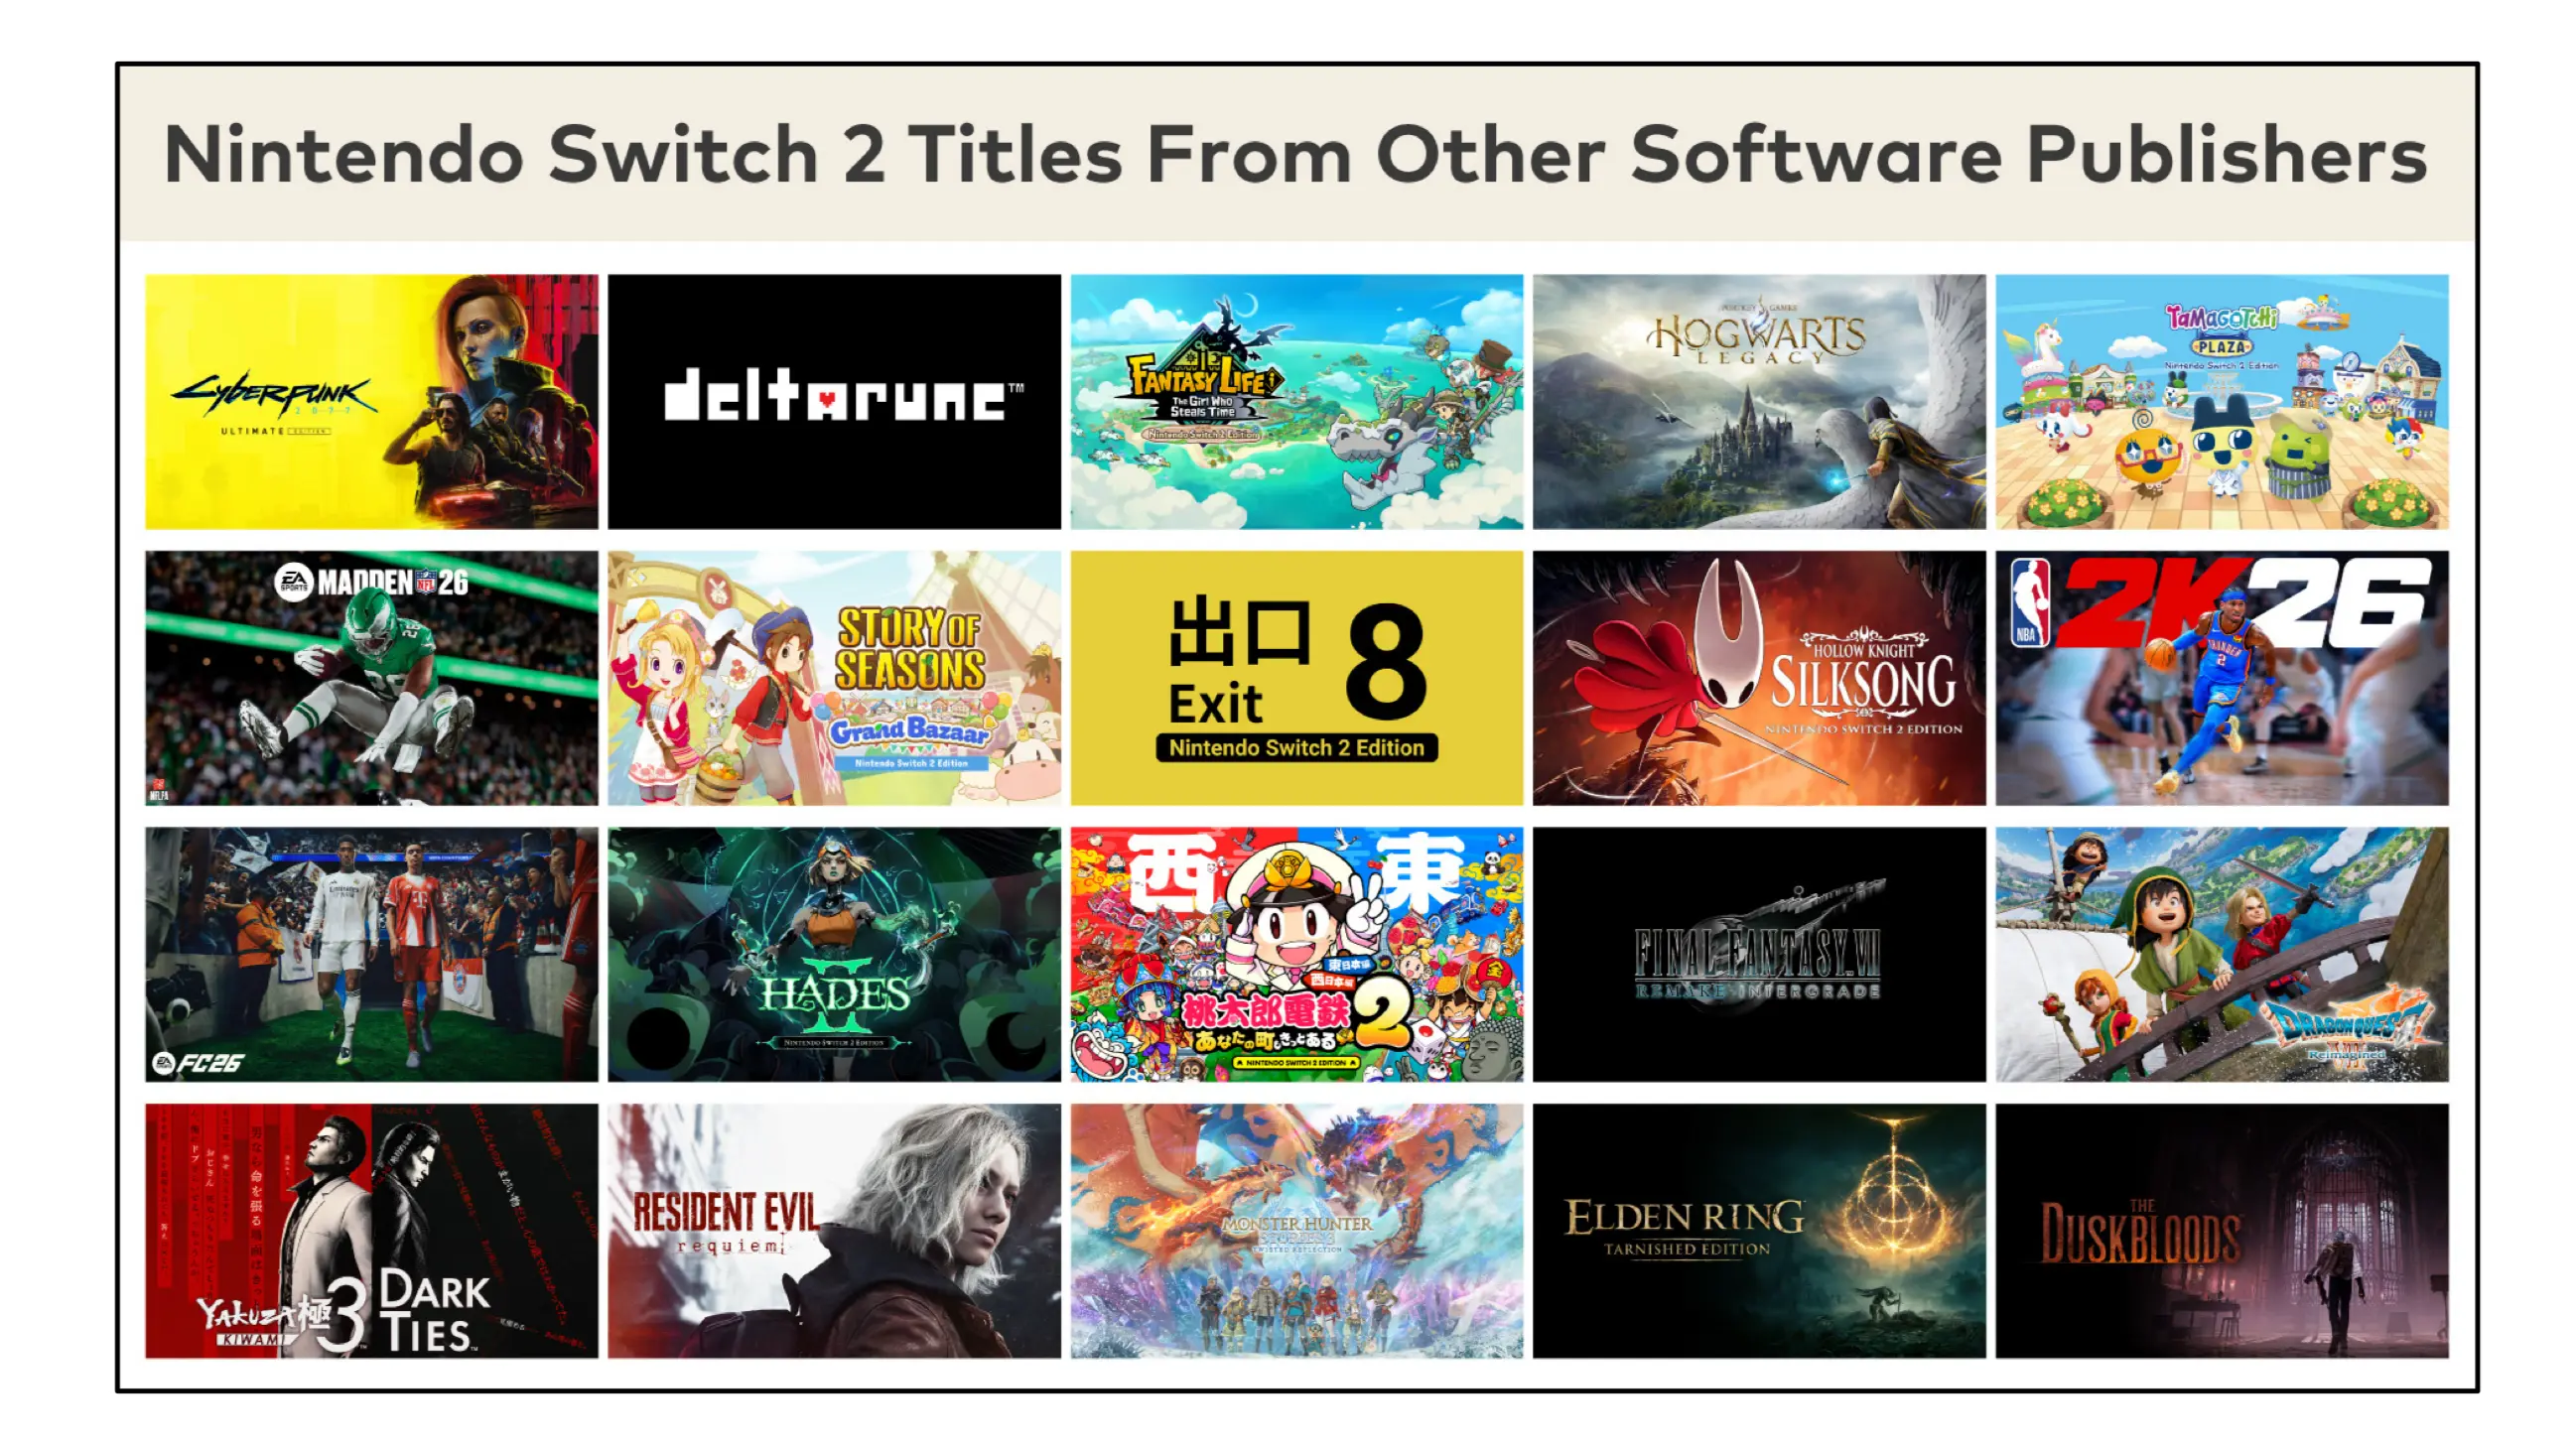
In terms of third-party software, the original Switch built a real third-party marketplace that translates directly to the Switch 2 while preserving players’ existing libraries. The difference maker though, is that Switch 2 is considerably more powerful than the Switch 1. For the first time, some of the most popular games ever made (The Witcher 3, Cyberpunk 2077, Elden Ring) will be able to run at high performance on Nintendo hardware, in handheld mode. Indie favourites (Stardew Valley, Silksong, Hades II) are also available. The significance is that, historically, gamers who wanted to play these third party games and Nintendo games needed to buy two consoles. The Switch 2 provides a reasonable solution for only buying one console, while getting the portability benefit that the Switch form factor provides.
Nintendo eShop Expansion:
4. Licensing, theme parks & film (~3–5% of revenue).
Super Nintendo World, the Super Mario Bros. Movie ($1.4B box office), Pokémon merchandise. These monetize the IP without cannibalizing the core business.
The Console Cycle
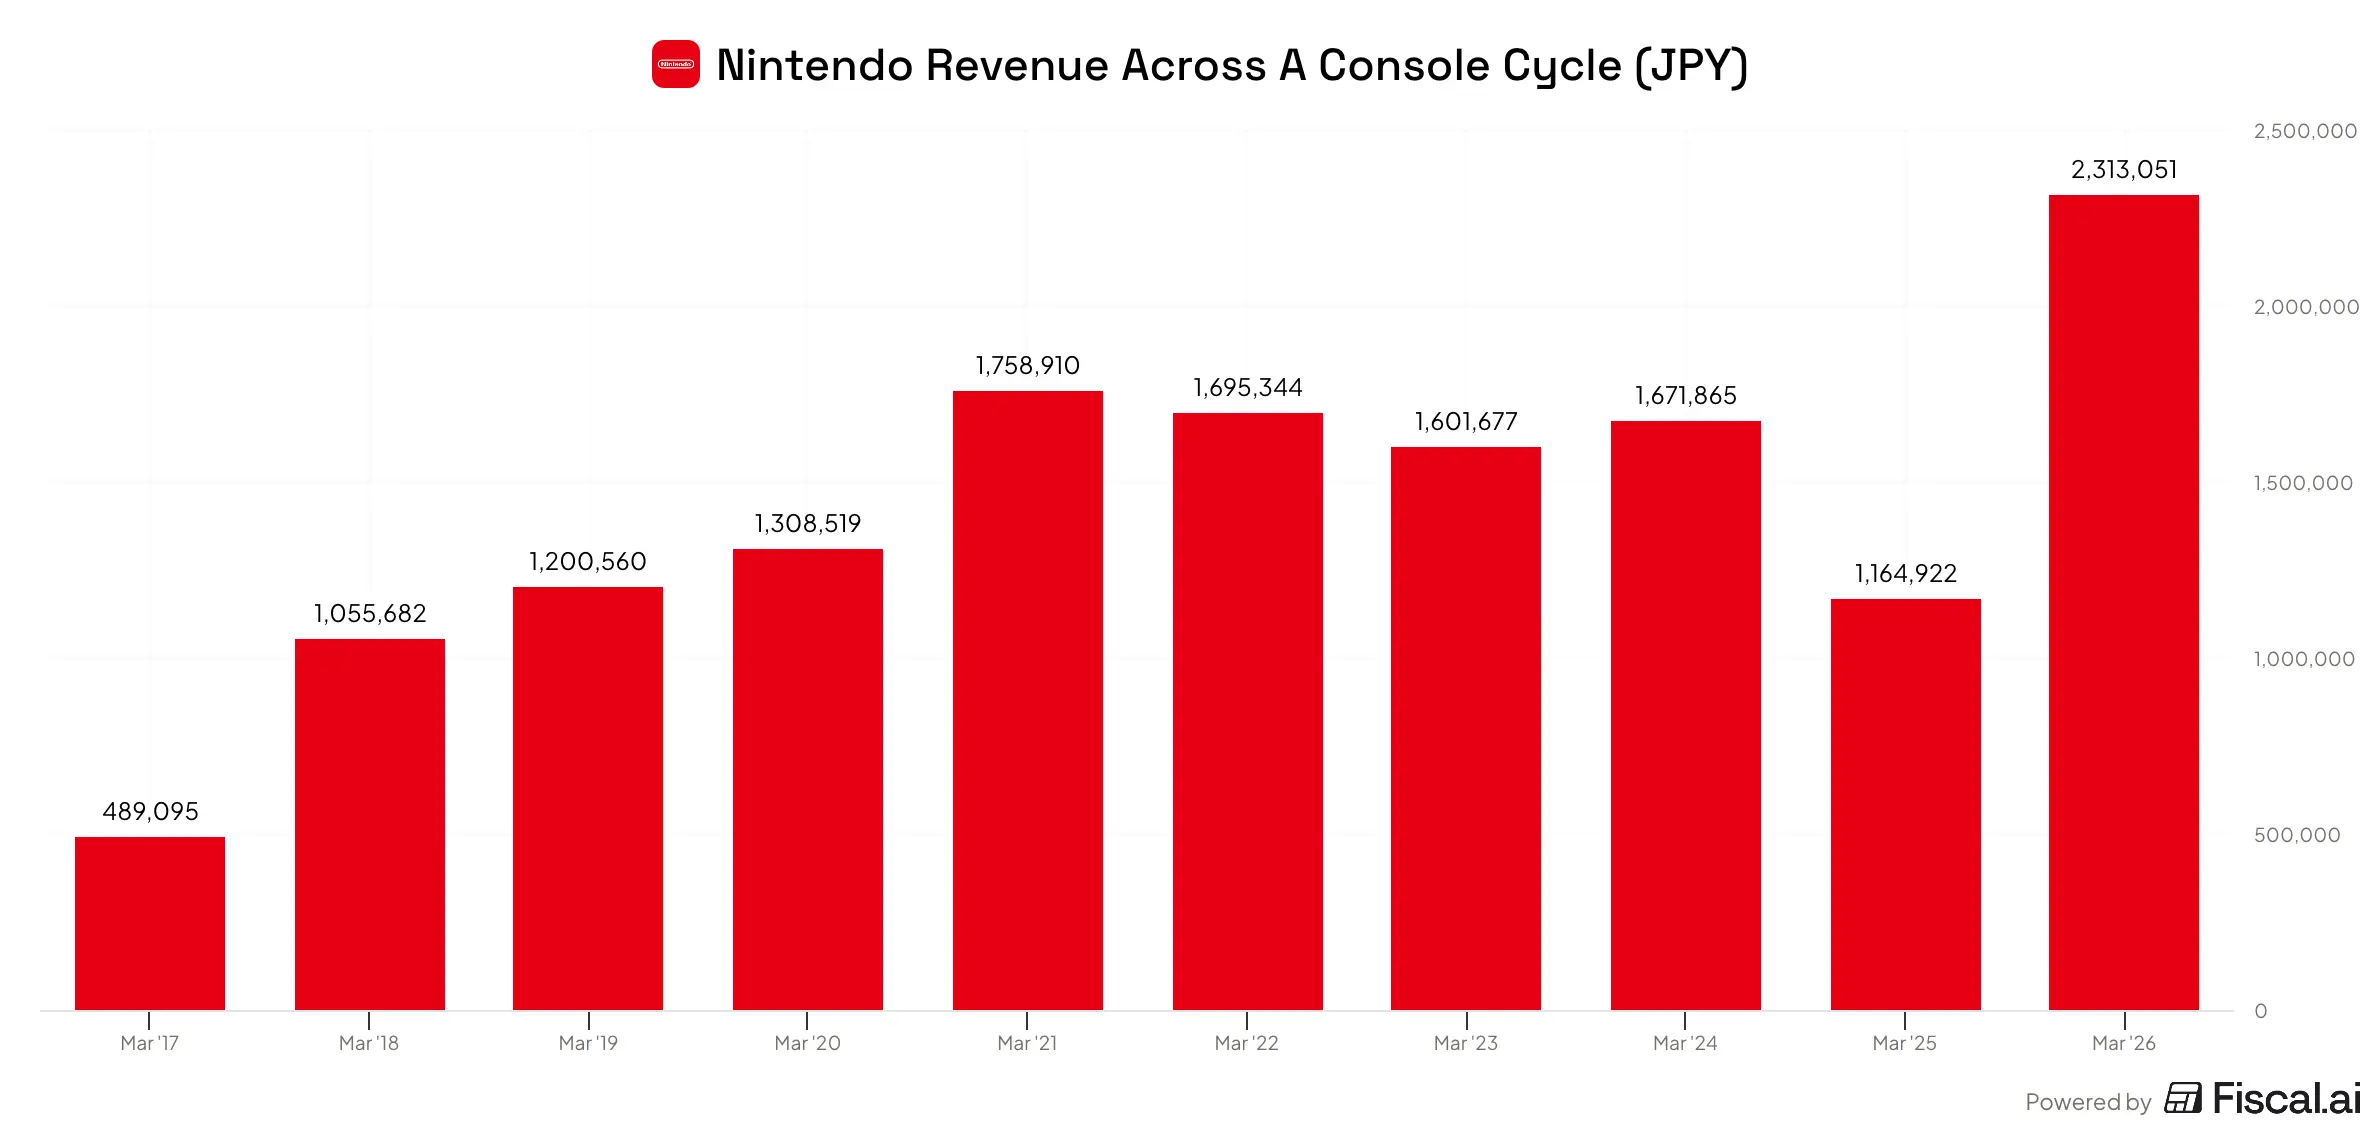
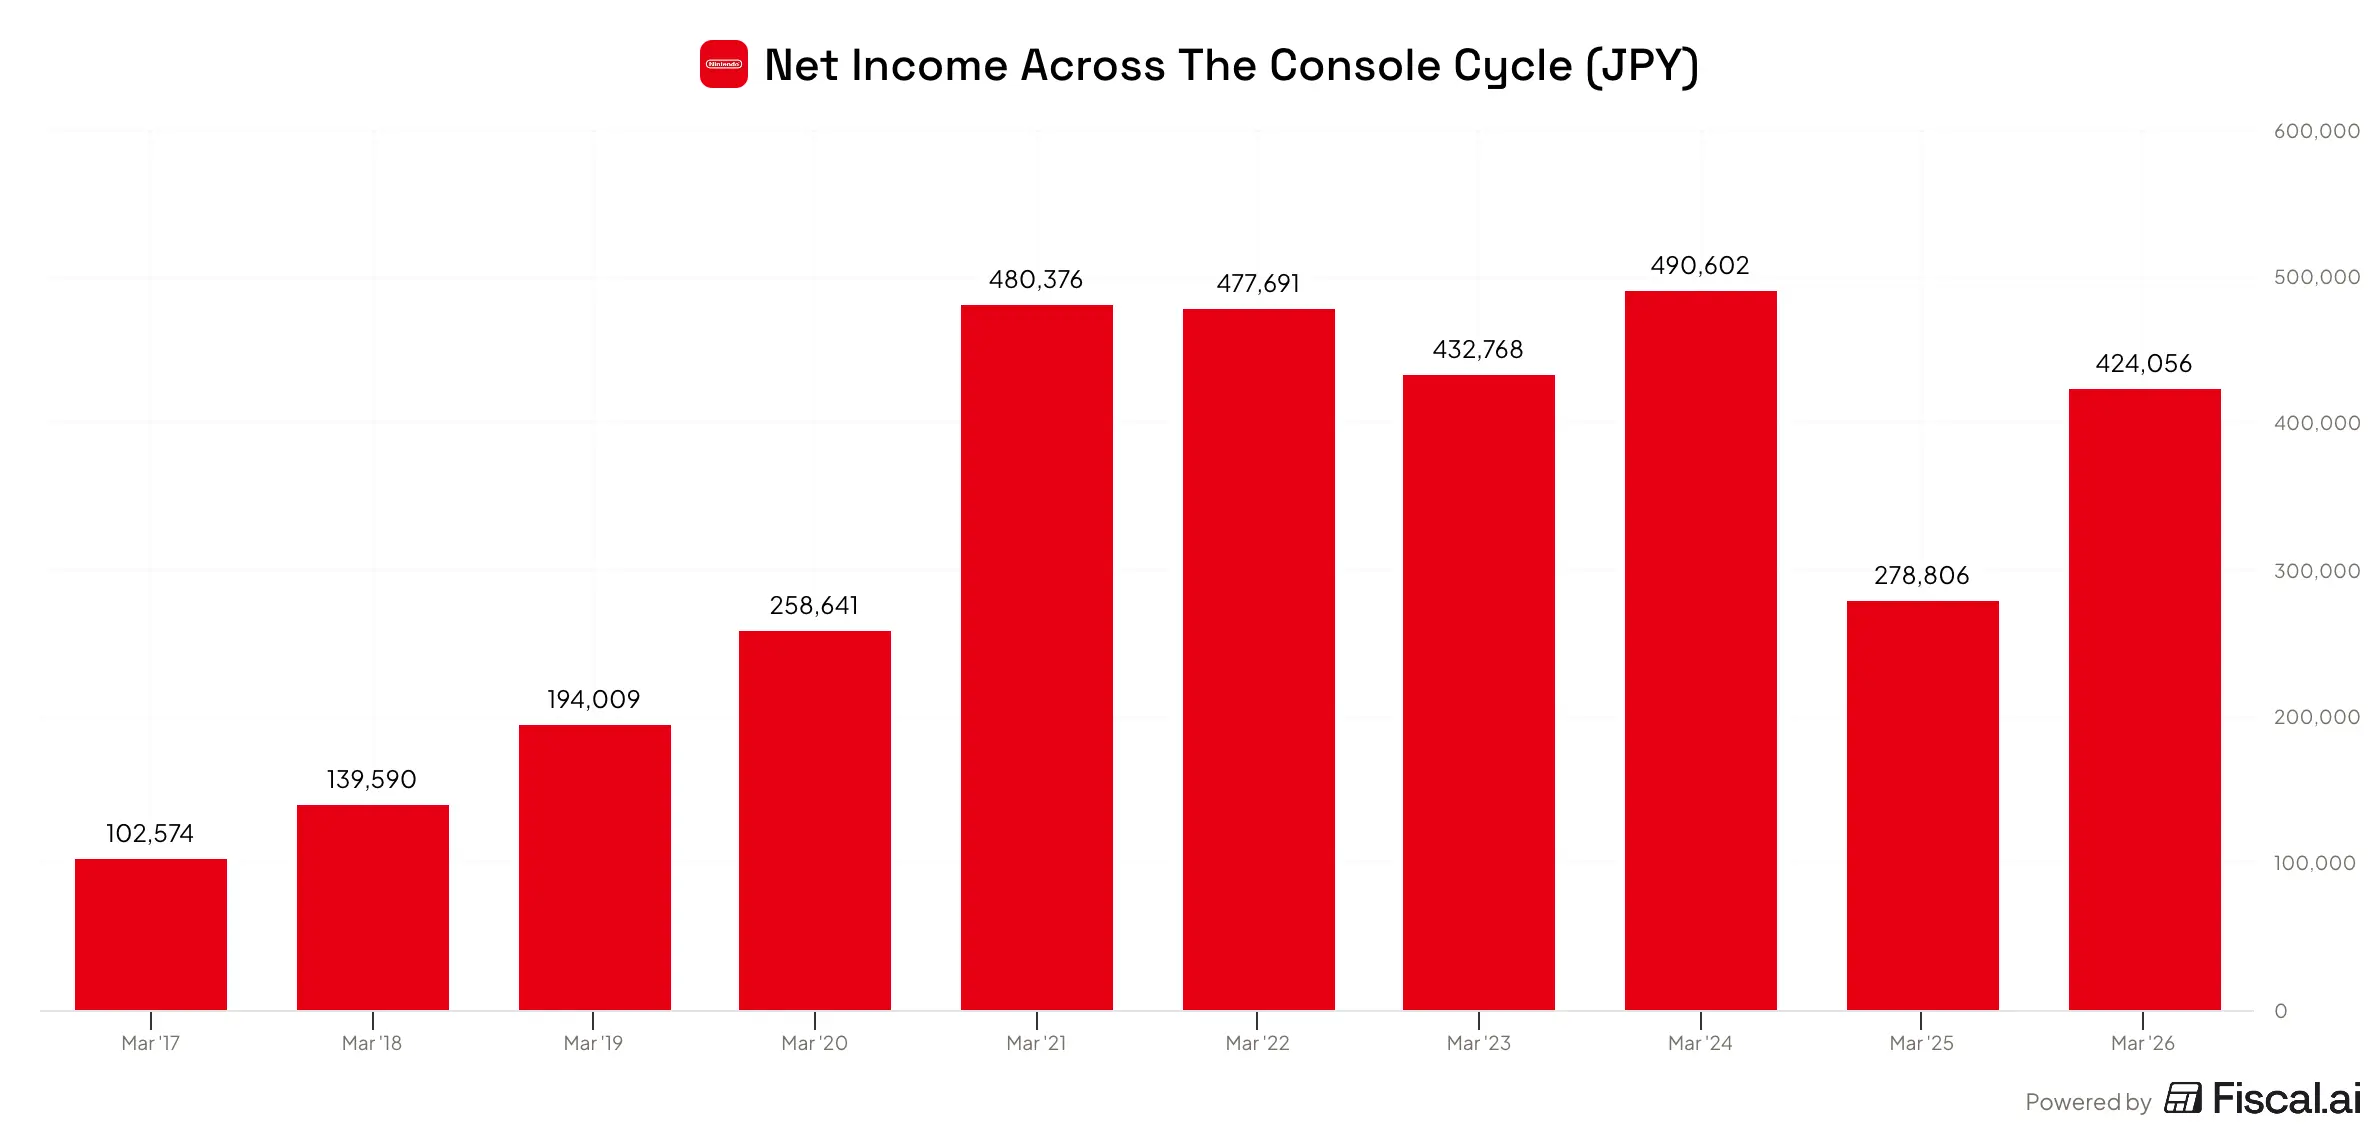
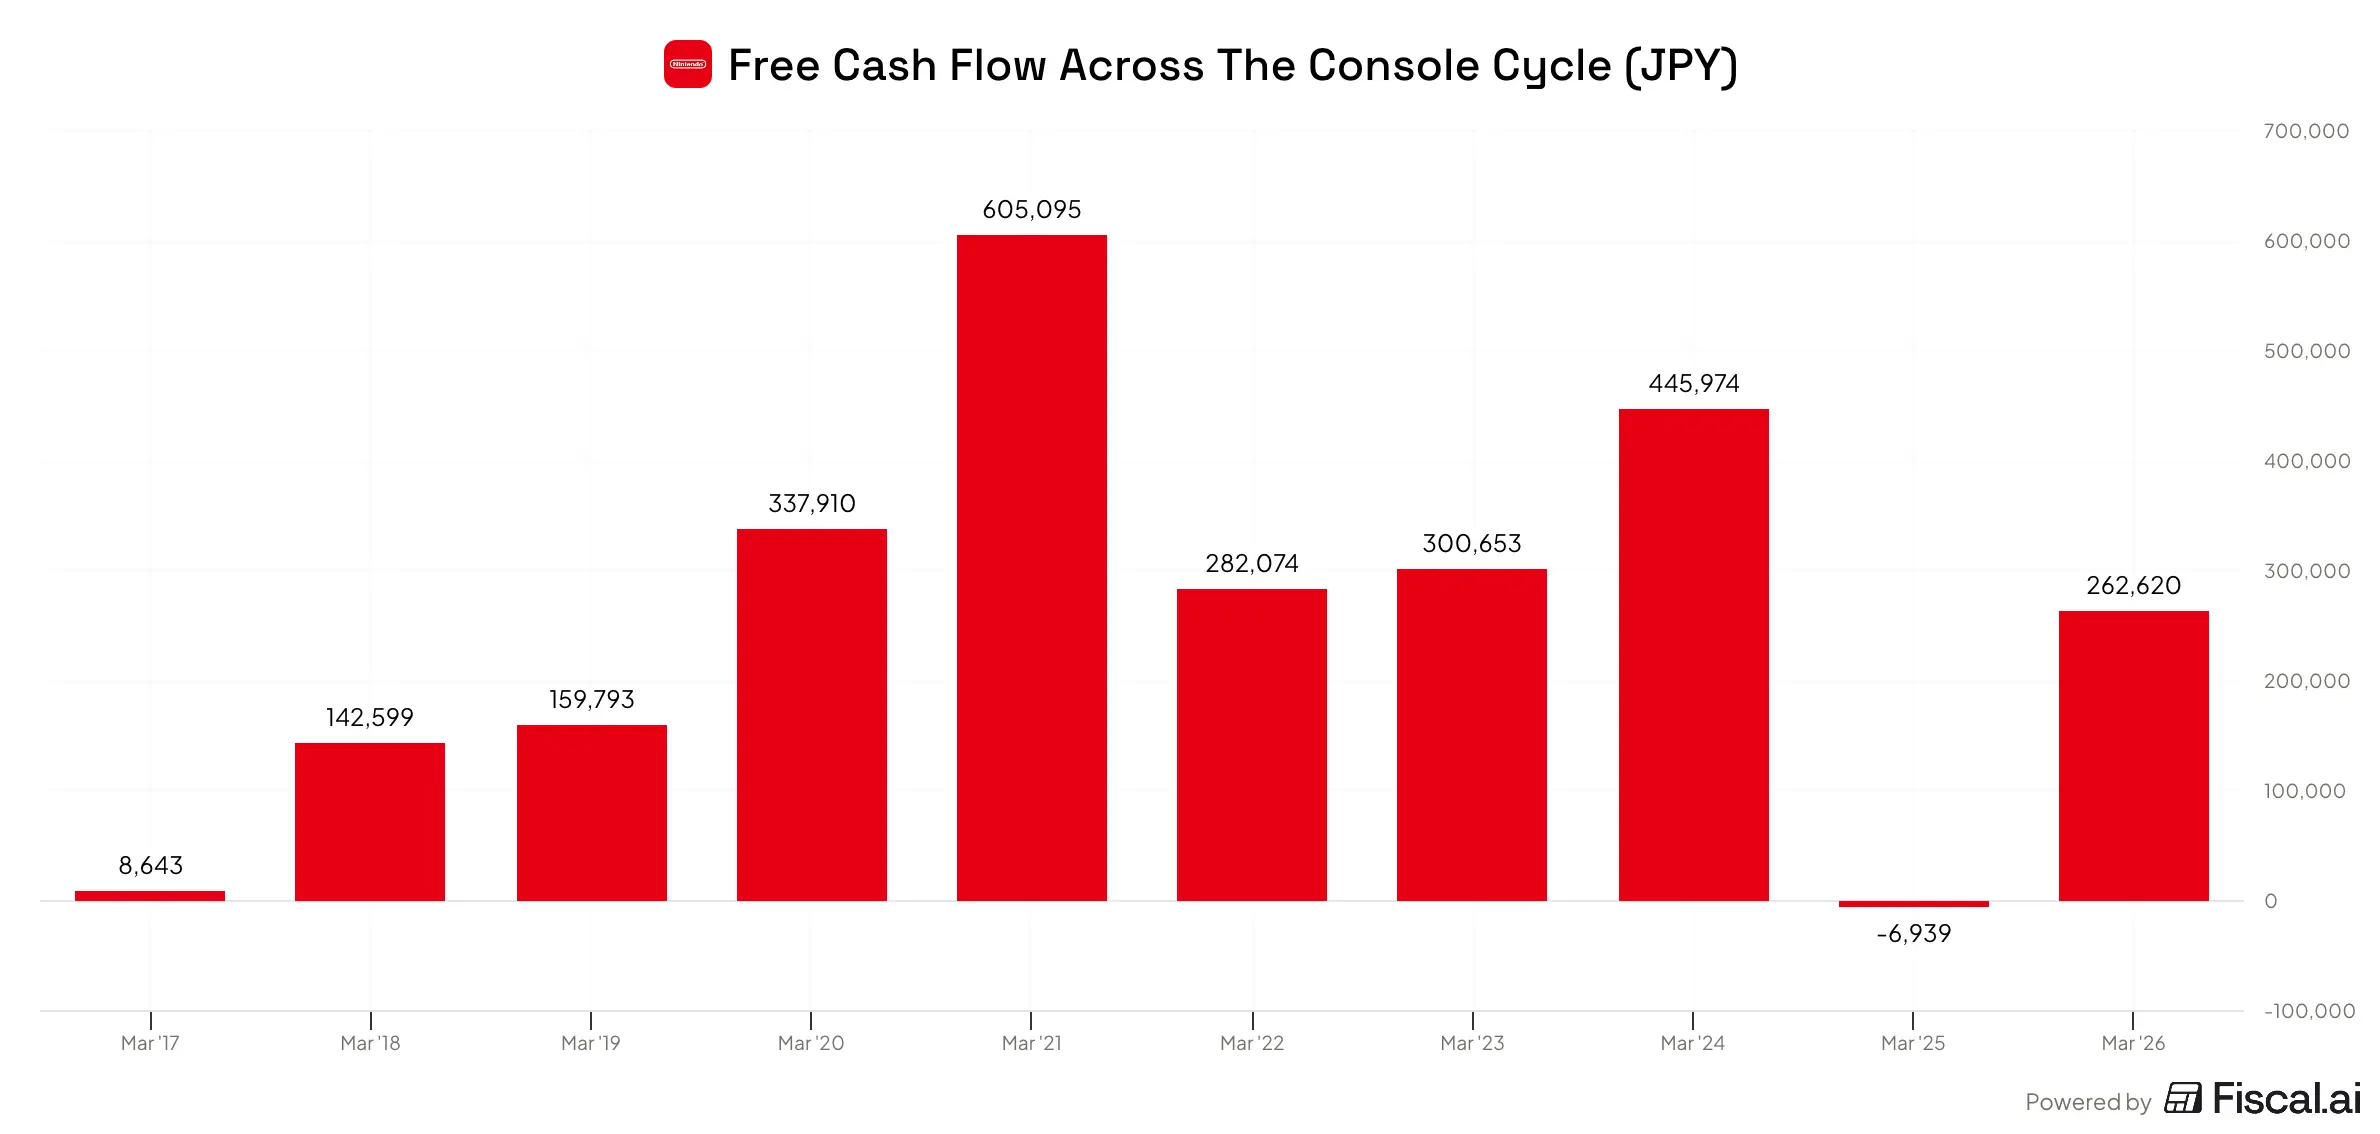
The structure of these revenue streams lead us towards the most important thing to understand for reading Nintendo’s financials: where you are in the console cycle. This is a company that will look completely different in a launch year versus a peak year. A launch year like fiscal 2026 shows revenue nearly doubling (+98.6%) as hardware volume surges, while the years immediately preceding a launch (fiscal 2025, -30.3%) show revenue troughing as the prior platform’s software tail winds down and buyers wait for the new device. An investor unfamiliar with this pattern who extrapolates any single year’s growth rate in either direction will misprice the business badly.
Business Quality Assessment
A Note on Nintendo’s Accounting
Nintendo reports under J-GAAP, not IFRS or US GAAP, which changes how the numbers should be read:
- R&D is expensed, not capitalized, which makes reported margins look conservative relative to IFRS peers.
- The ~32% stake in The Pokémon Company flows through equity income, not consolidated revenue. This means that operating income, free cash flow, and the balance sheet all understate the true economic scale of the Pokémon relationship. Pokémon sits on the balance sheet at cost plus retained earnings, not fair value, despite being the best-selling media franchise of all time.
Bottom line: most of the standard measures we’d use to assess Nintendo are naturally conservative because of how the company chooses to account for and report the business.
ROIC Analysis
Nintendo’s return on invested capital tells the console-cycle story almost perfectly:
- 6.8% in FY17, at the launch of the Switch 1.
- 27% in FY18
- ~40% between FY20 and FY24, normalizing for the pandemic.
- ~20% in FY25 as the business ramped up for the launch of the Switch 2, building inventory without the revenues to compliment it.
- 22% in FY26 at the launch of the Switch 2.declining steadily to 15.6% (FY23),
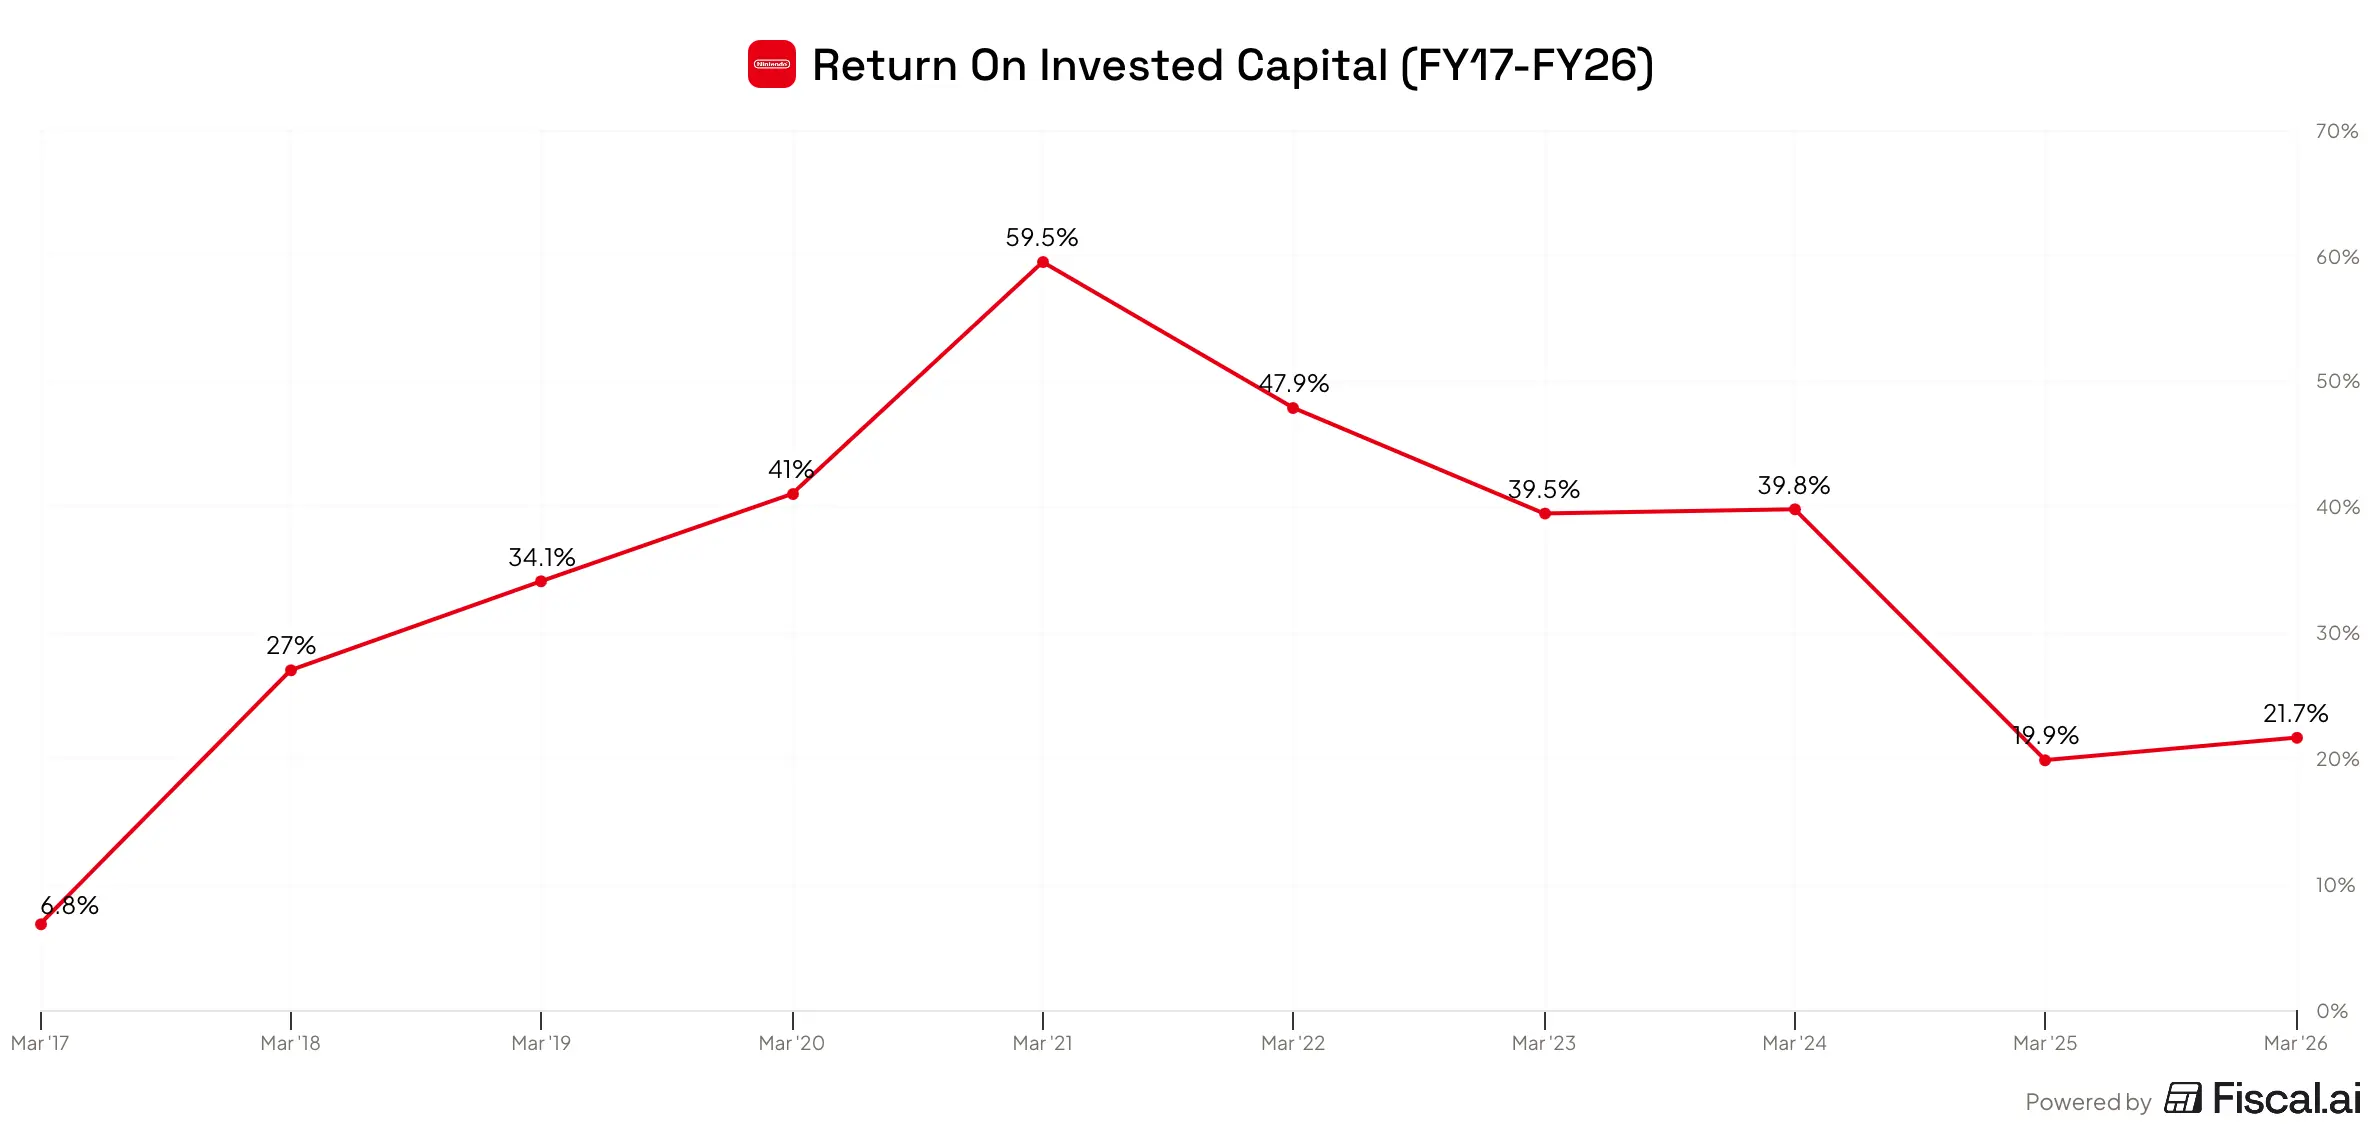
The relevant question is not “what is ROIC today?” but “what does ROIC average across a full seven-to-eight-year cycle?“. On that basis, given Nintendo has no debt and WACC is limited to the cost of equity, the business as certainly cleared its cost of capital by a wide margin every year since at least 2017.
The other key item to note from the chart above is the improvement in the ROIC between the Switch 1 launch year and the Switch 2 launch year. The improvement represents meaningful improvement in the stability of the business through the NSO subscription, backwards compatibility of games on the Switch 2, third-party games, and IP licensing revenues, all working to raise the baseline of the business, regardless of console-cycle timing.
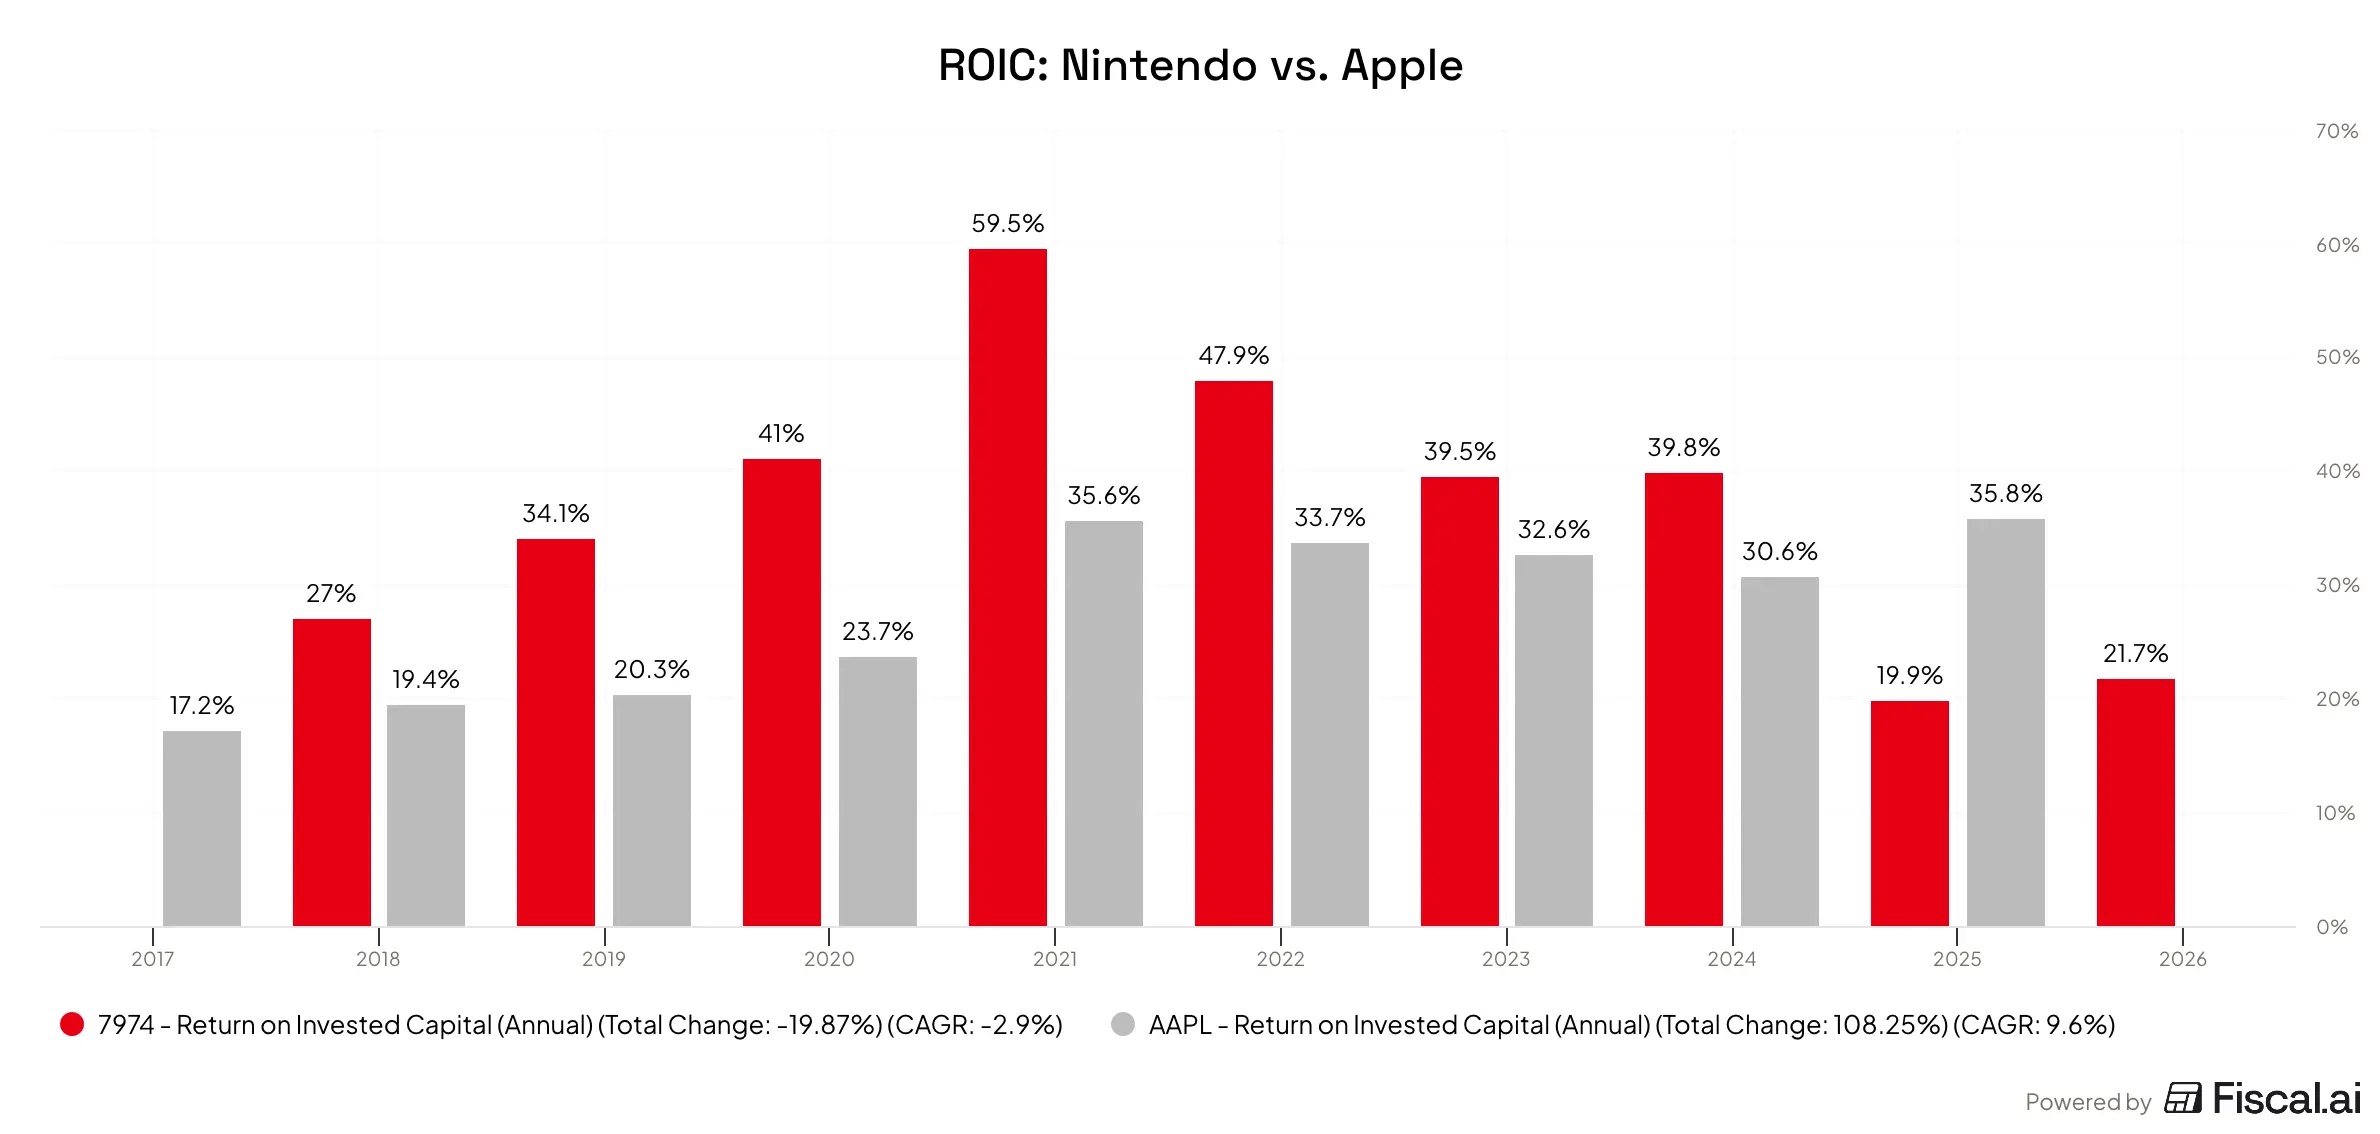
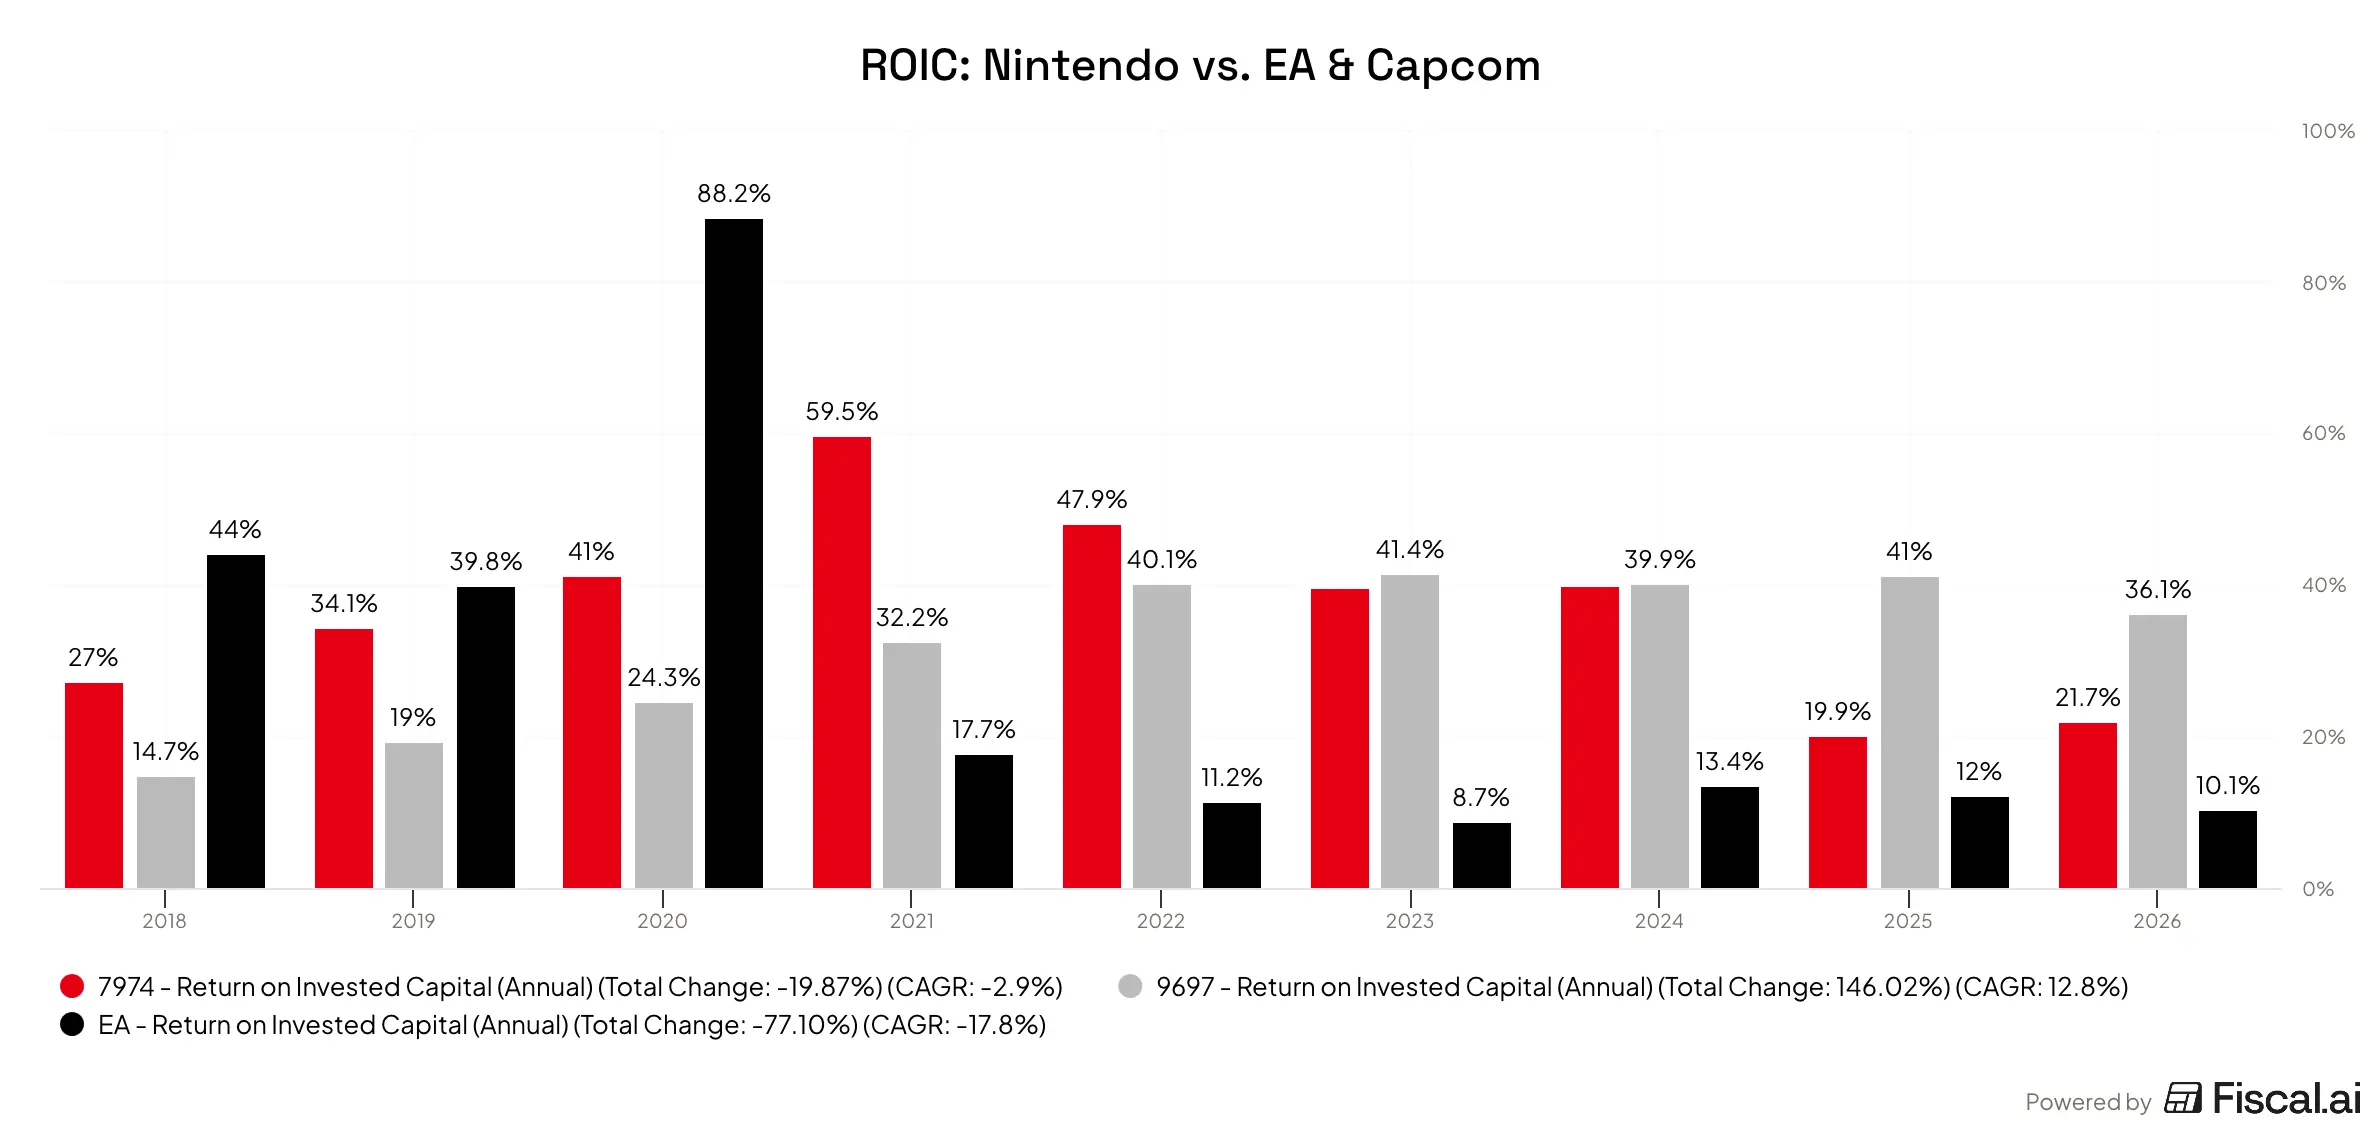
Peer triangulation: Nintendo is difficult to comp against competitors given the cycle dynamics and the fact that its nearest competitors are massive conglomerates. However, we can attempt to triangulating against a business like Apple who operates a similar hardware/software model, Capcom as another Japanese game developer, and EA as an international game developer with strong franchises like EAFC (previously FIFA).
Takeaways:
- Apple comparison looks flattering for Nintendo as a quality business outside console-release years.
- Capcom tracks roughly even, except in hardware upgrade years.
- EA looks notably worse even as pure-software peer with far more aggressive micro-transaction implementation.
Free Cash Flow Profile
Each of Nintendo’s lines of business has a completely different FCF conversion profile (FCF ÷ Net Income):
Hardware (consoles) — low conversion. Manufacturing, distribution, and inventory investment compress cash. Volatile, and heavily dependent on proximity to a launch. Low conversion here is structurally expected — it funds the install base.
Software (games + NSO) — high conversion. Near-zero marginal cost on digital sales. Digital should be approaching 90–100% conversion by nature. NSO subscriptions collect cash upfront so should actually be over 100%.
IP licensing (parks, film) — high conversion. Very high conversion, predictable, low-capex. Still small (3–5% of revenue) but growing, and the Super Mario Bros. Movie’s $1.4B box office demonstrates real scale potential if Nintendo ever leaned in harder.
Blended FCF conversion, then, depends entirely on segment mix, which depends entirely on where you are in the hardware cycle.
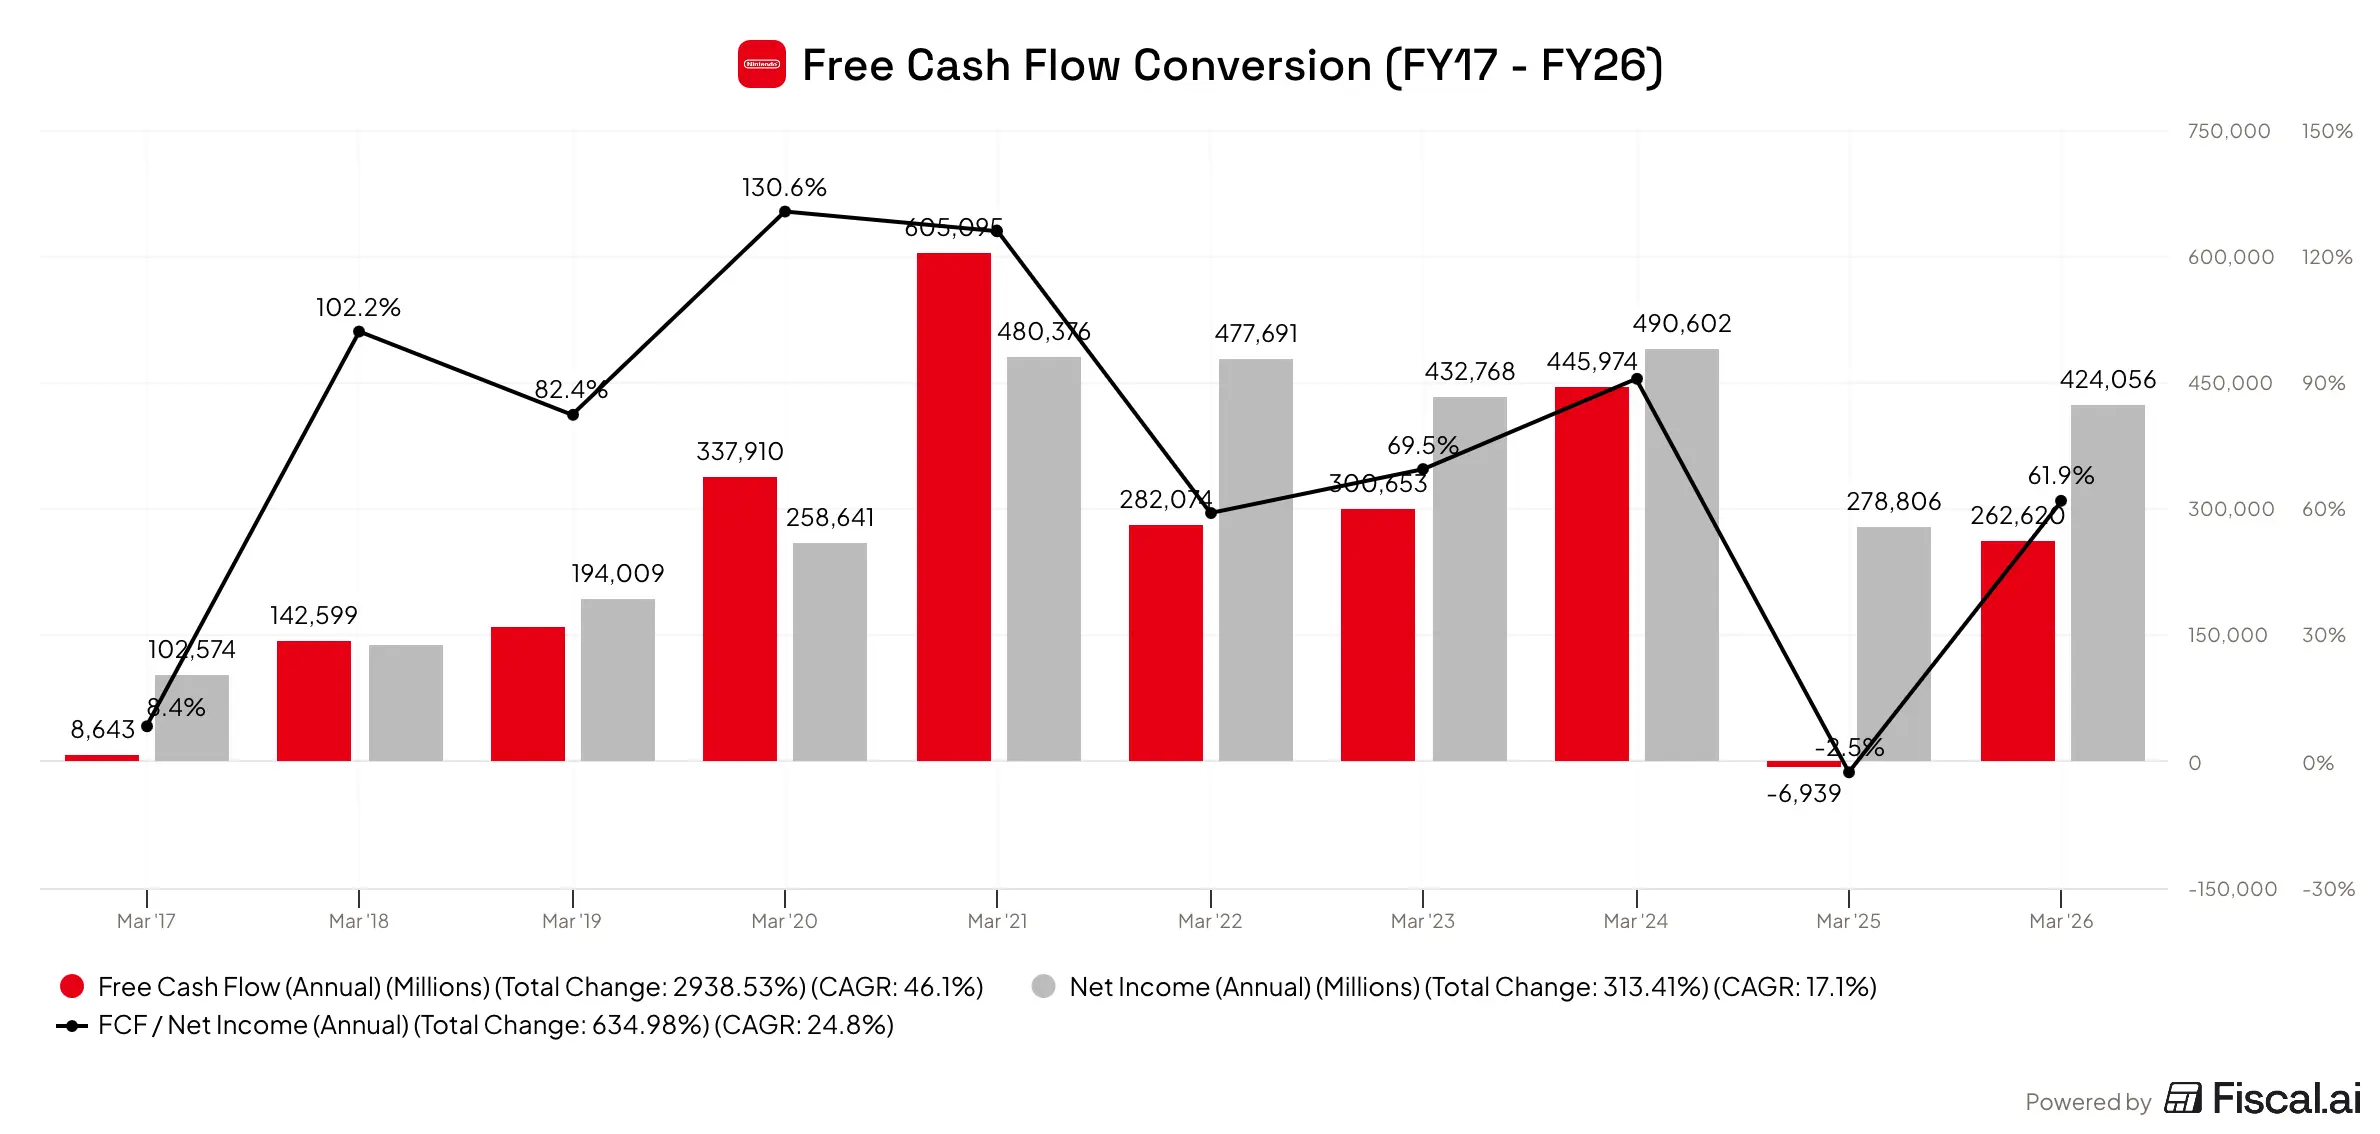
Reading the actual track record: FCF conversion tracks the hardware cycle almost exactly as you’d expect, and the multi-year average represents a strong steady-state ability to generate cash. The one anomaly is FY21, during the Covid-19 pandemic. FCF and earnings spiked on pulled-forward demand, and the scale of that FCF conversion suggests the spike came mostly from games, not consoles. The spike also created a large tax liability needing to be paid in FY22, creating the gap between FCF and net earnings in that year.
Gross Margin Structure
Using information provided in Nintendo’s financial reporting, it is possible to estimate the gross margins on each of the four revenue segments.
| FY26 Revenue (¥B) | Est. Gross Margin | |
|---|---|---|
| Hardware sales | ¥1,493 | 15% |
| First-party software | ¥556 | 80% |
| Third-party games & NSO | ¥190 | 95% |
| IP-related sales | ¥74 | 85% |
| Total | ¥2,313 | 39.3% |
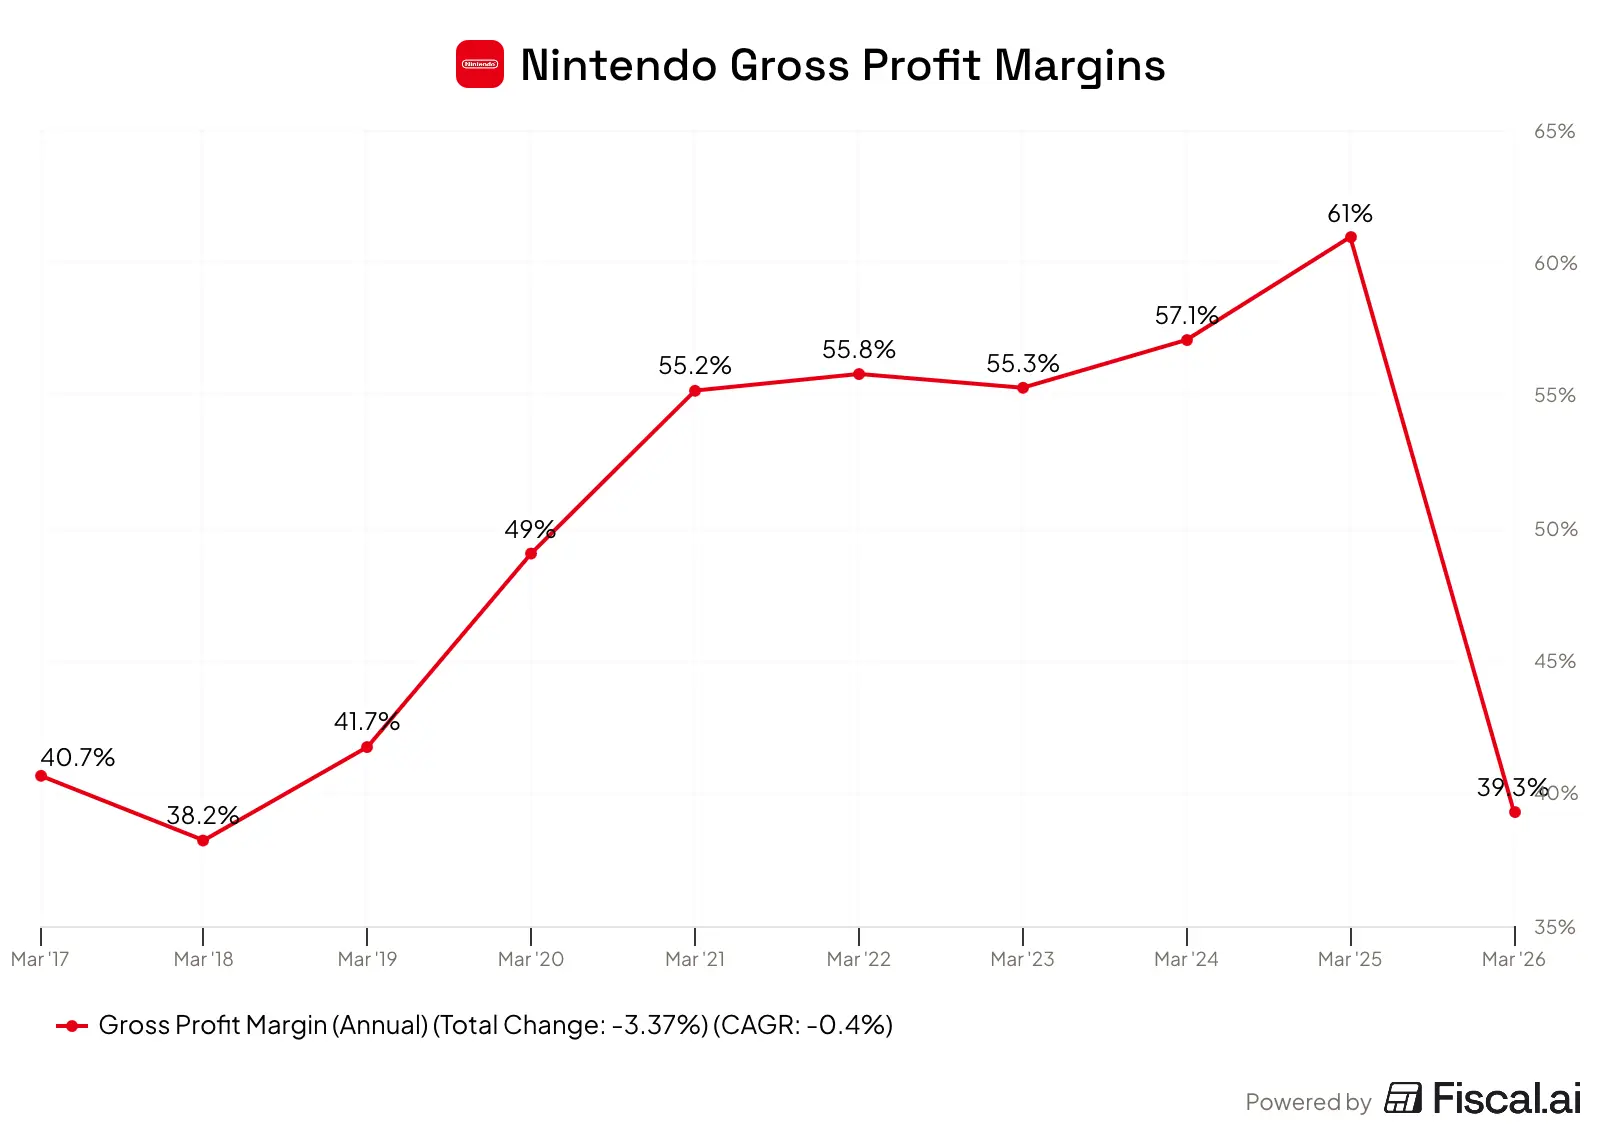
Looking back historically once again demonstrates the impact of the console cycle on the business. Gross margin ran 55-61% through fiscal 2022-2025 as the aging Switch’s revenue mix skewed toward high-margin digital software late in its life. It then fell sharply to 39.3% in fiscal 2026 as the margin-thin hardware became a much larger share of the revenue mix in the launch year. Expect gross margin to climb back toward the mid-50s as the digital software tail builds over Switch 2’s life, the same pattern the original Switch traced.
3. Balance Sheet Health
Nintendo Net Debt (FY17-FY26):
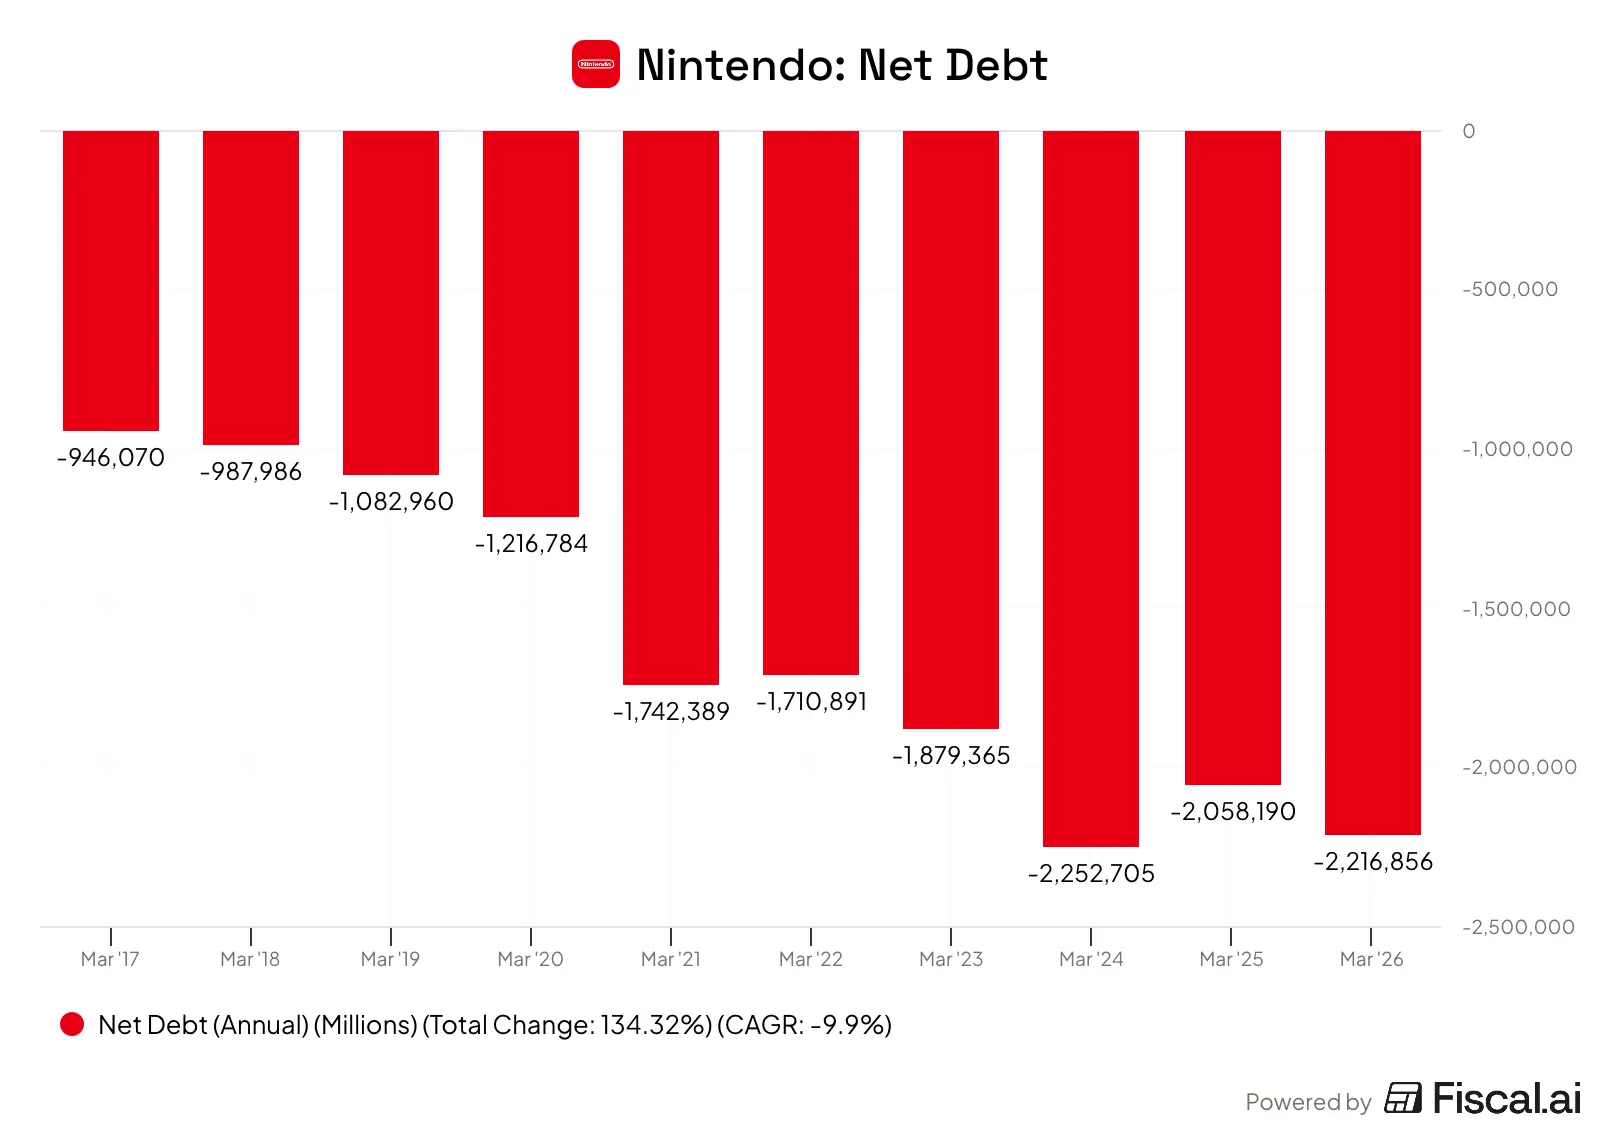
This is as close to a fortress balance sheet as exists in consumer entertainment. Total debt is effectively zero across the entire observable history. This is obviously great. Nintendo’s balance sheet is managed so that it can never go out of business due to debt and has the best chance possible at being around 10,20, 100 years from now. It is a long term view and that is what I like to see in businesses.
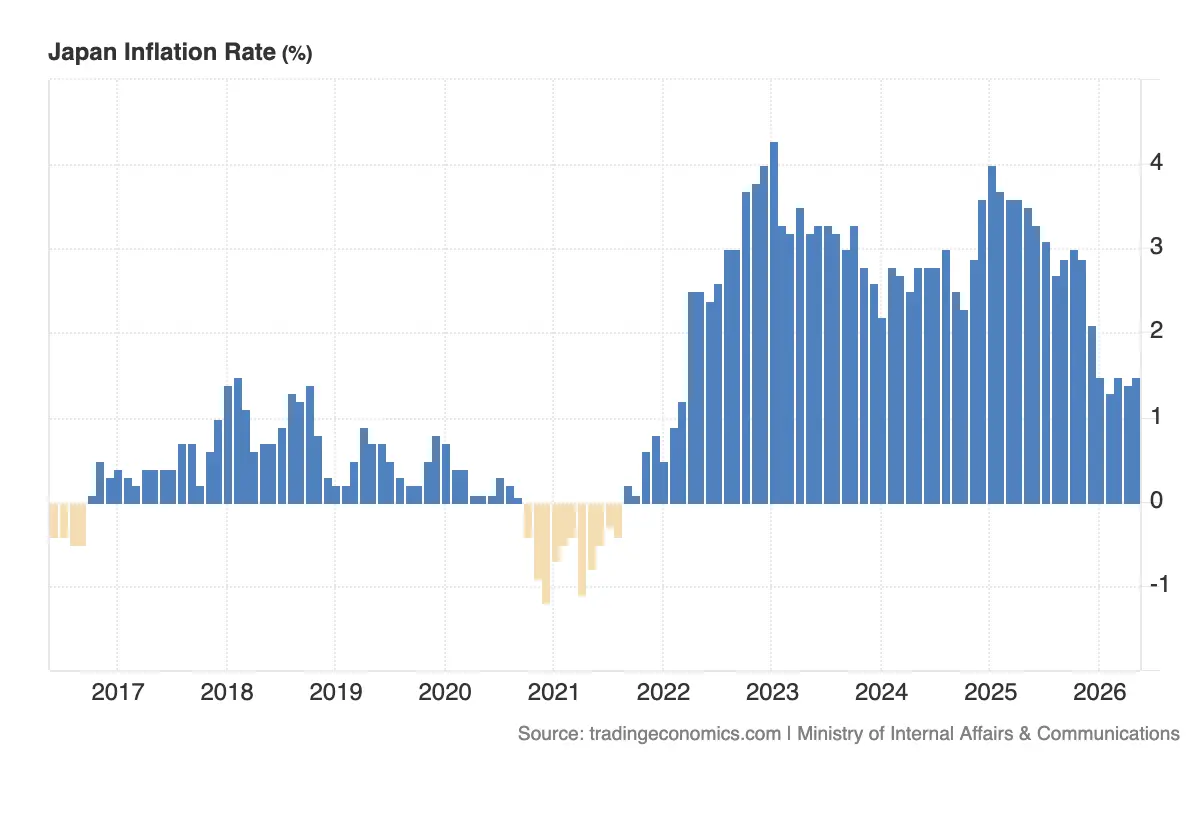
The more nuanced discussion is actually whether this is too much cash. At over ¥2 trillion (~$14B), Nintendo’s cash pile represents roughly 25% of its entire market cap. In a Japanese interest rate environment, where rate have sat near zero for decades, that is cash that is effectively being burned away by inflation, rather than being reinvested back into the business, or redistributed to shareholders.
This is actually a long running problem with the Japanese corporate environment, and since 2023, the Tokyo Stock Exchange (TSE) has begun to push heavy pressure on it’s listed businesses to act in a more cost of capital aware manner.16 This is a step in the right direction, and may actually represent significant upside in Nintendo and the Japanese market as a whole as a broad shift to better capital allocation could drive re-ratings across the exchange. Furthermore, since the Covid-19 pandemic, Japan has seen persistently high inflation rates. While this has furthered the acceleration of cash deterioration, high inflation may actually be pushing Japanese business culture toward meaningful change in how capital it managed.17
Japan Inflation Rate (10Y)18
For Nintendo though, the cash discussion deserves a bit more nuance. Nintendo’s cash to operating expense ratio over the last ten years, has actually maintained remarkable stability between the range of 4-6 years. In fact, the periods of higher cash can also be specifically seen to sit during key periods of uncertainty in Nintendo’s history. FY17 marked the launch of the Switch 1, FY21 and years following marked the pandemic, and FY24 marked the ramp up for the Switch 2.
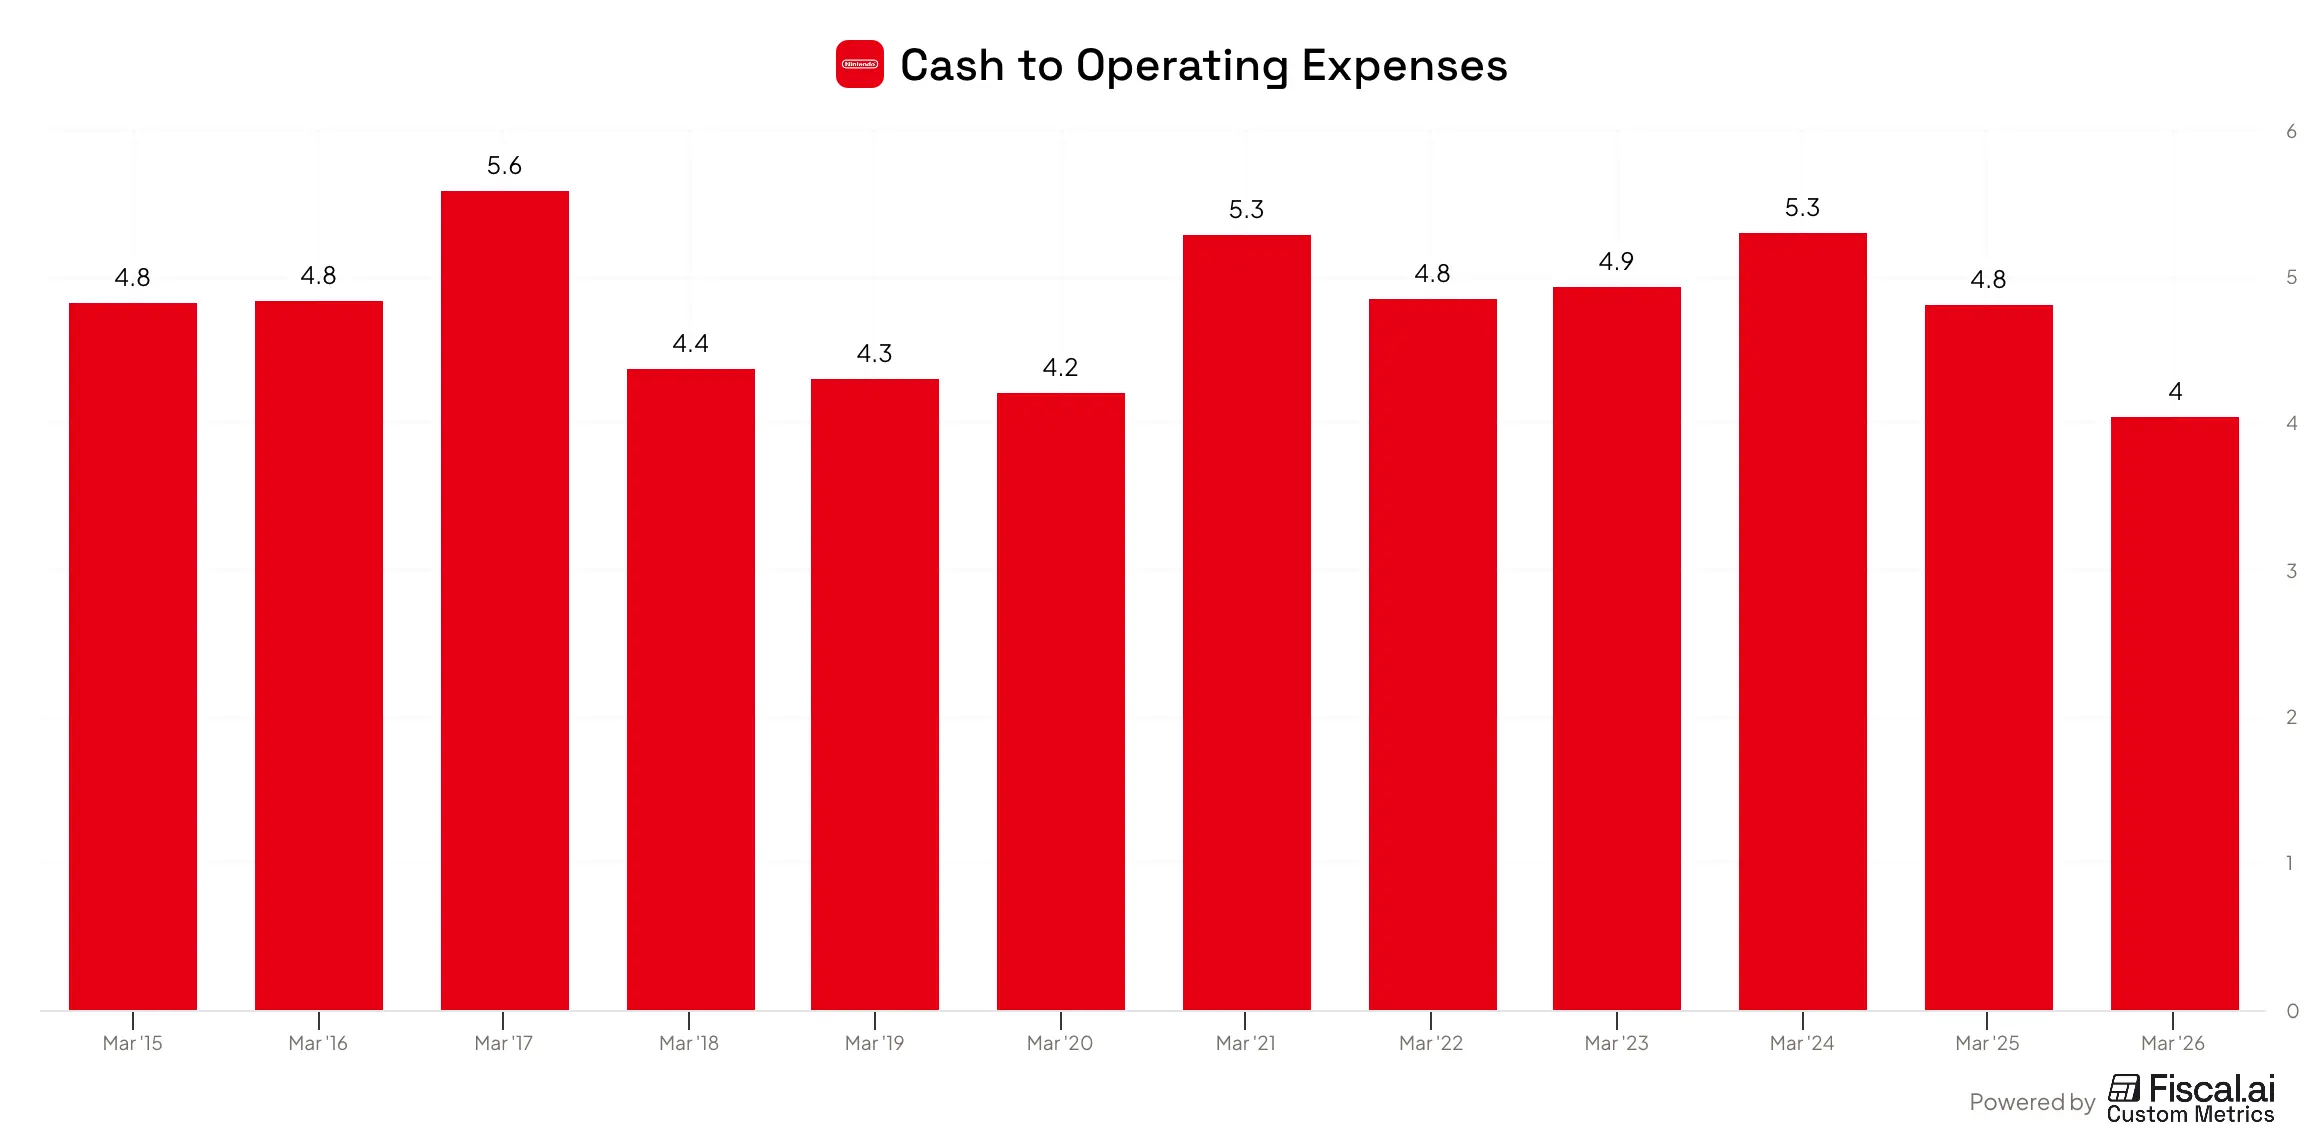
Pairing this finding with comments from Nintendo’s leadership in the past, we can begin to form an understanding of why Nintendo feels it is important to hold such a large cash position.19
1. Console transition insurance. For decades, Nintendo has chosen to take genuinely boundary-pushing risks with its hardware in order to create unique gaming experiences. The gameboy, the Wii, the Switch, were all massive gamble that paid off, but were uncertain to do so at the time. In fact, these gambles have not always paid off. The Wii U, the little know successor of the Wii, sold only 13.5M units20 , and is the clearest example of the failures that taking big swings can produce. Staying debt-free means keeping enough cash on hand to survive a fully failed console cycle — about 4-5 years.
2. Hype protection. If Nintendo were reliant on debt or equity markets, it would need to pre-announce consoles and games much earlier in order to raise funding for developing. In the gaming industry, hype is closer to a resource than an effect and must be managed in order to maximize sales of a product. Being self-reliant on capital allows Nintendo to do that to the best of its ability.
3. Preferred access to partners. Nintendo believes it gets preferential vendor treatment because it can guarantee long-term obligations, backed by the size of the cash pile. This is more relevant than ever in a world where AI data centre demand is pushing component prices higher across the entire electronics sector.21
At the same time, over the past 10 years, Nintendo has returned roughly 67% of its free cash flow to shareholders.
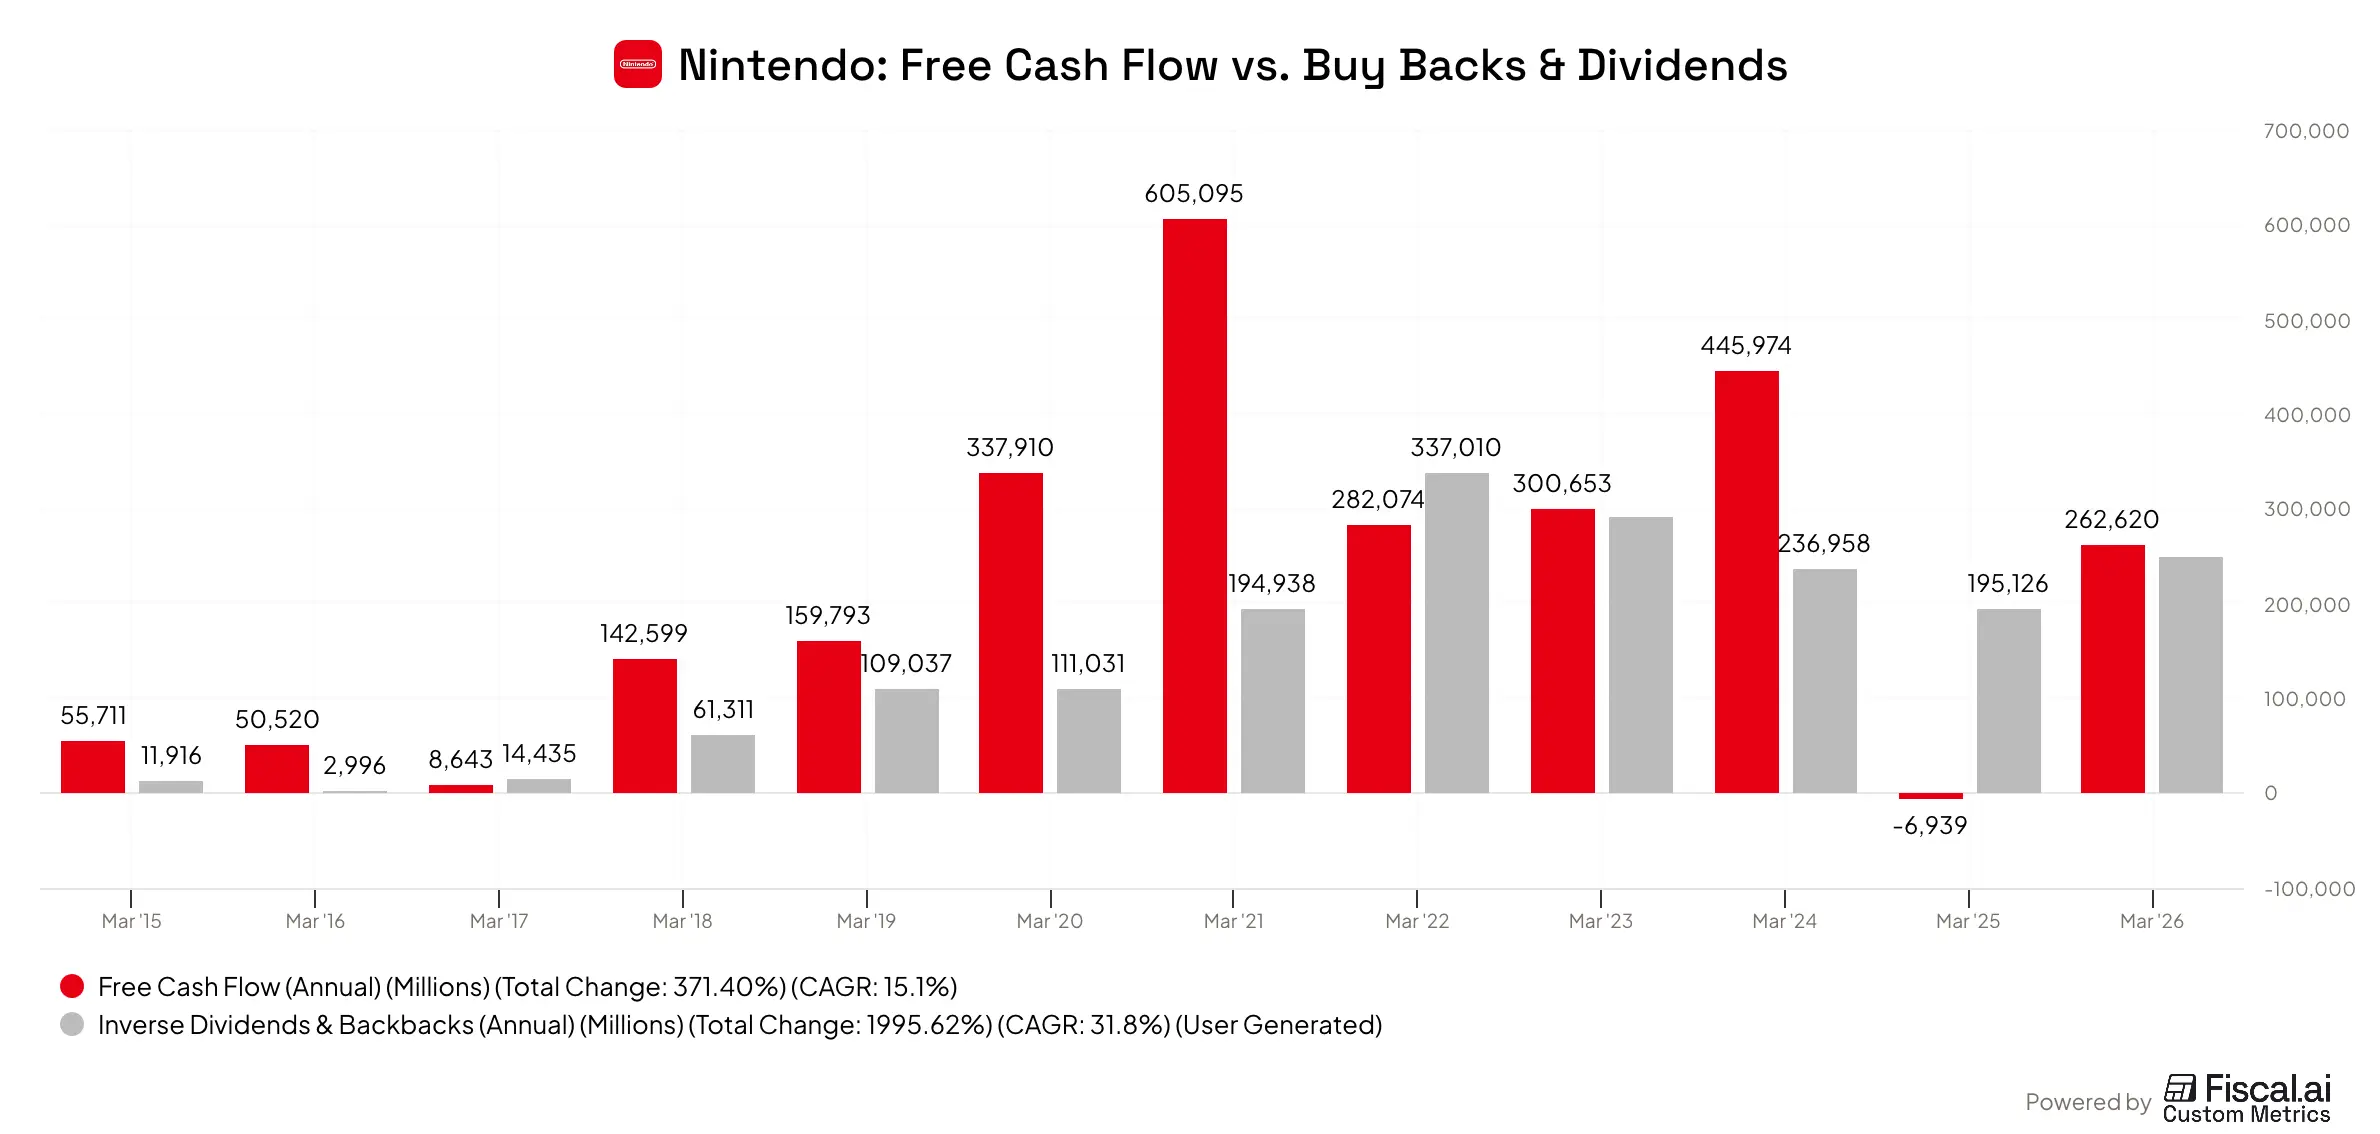
So, based on the above analysis, I don’t think it is fair to label Nintendo as a cash hoarder along with some of their Japanese-listed peers. Rather, Nintendo is business with a long term view and the ability to remain self-funded while taking big risks in the pursuit to surprise and delight their customers, at the cost of holding a large cash balance. This not something to hold against them, it is rare to see a business take such a long term view, especially in a industry that is otherwise rife with poor management. But, it is something of recognize in one’s evaluation of the business, since this cash balance is unlikely to ever be available to shareholders via distributions.
4. Moat Analysis
Intangible Assets
The IP is, and has been for the company’s modern history, the dominant source of Nintendo’s moat. Mario, Zelda, Donkey Kong, Animal Crossing and the others, were created inside Nintendo and have been continuously developed by the same internal studios for decades. Pokémon is partially-owned through Nintendo’s 32% stake in The Pokémon Company alongside Game Freak and Creatures Inc22. This is fundamentally different from a publisher that licenses characters from a studio or acquires franchises through M&A. Nintendo effectively operates its creative pipeline end to end, which means that there is no royalty leakage, no licensing renewal risk, and complete control over how and when characters appear across games, film, and theme parks.
The Buffett moat test asks: “if I handed a potential disruptor an unlimited cheque book, could they replicate and displace the business?“.
To this, the answer is an overwhelming “no”. Competitors have tried to buy their way to comparable IP depth. In 2023, Microsoft purchased Activision-Blizzard (Call of Duty, Candy Crush, World of Warcraft) $68.7 billion and still lack anything resembling Nintendo’s family-franchise breadth23.
The strength of the IP, however, is not just due to its breadth, but its durability. Nintendo’s stewardship of the characters, trademarks, etc. has also lead to an unusually cultural significance of the characters and games created throught the following features.
Multi-Generational Renewal
Most legacy IP eventually becomes a nostalgia play. It’s valuable to the generation that grew up with it and decays with each new cohort that doesn’t discover it fresh. The advantage Nintendo has been able to create is that the core characters are re-introduced to new children roughly every console generation because previous generations are fans of the characters and games. Nintendo’s spend considerable effort to make games that a fun for all ages and that can be played by young and old people together. Mario Kart is simple and fun for the whole family, Super Smash Bros. is great for sibling co-op.
Nintendo’s Multi-Generational Strategy:24
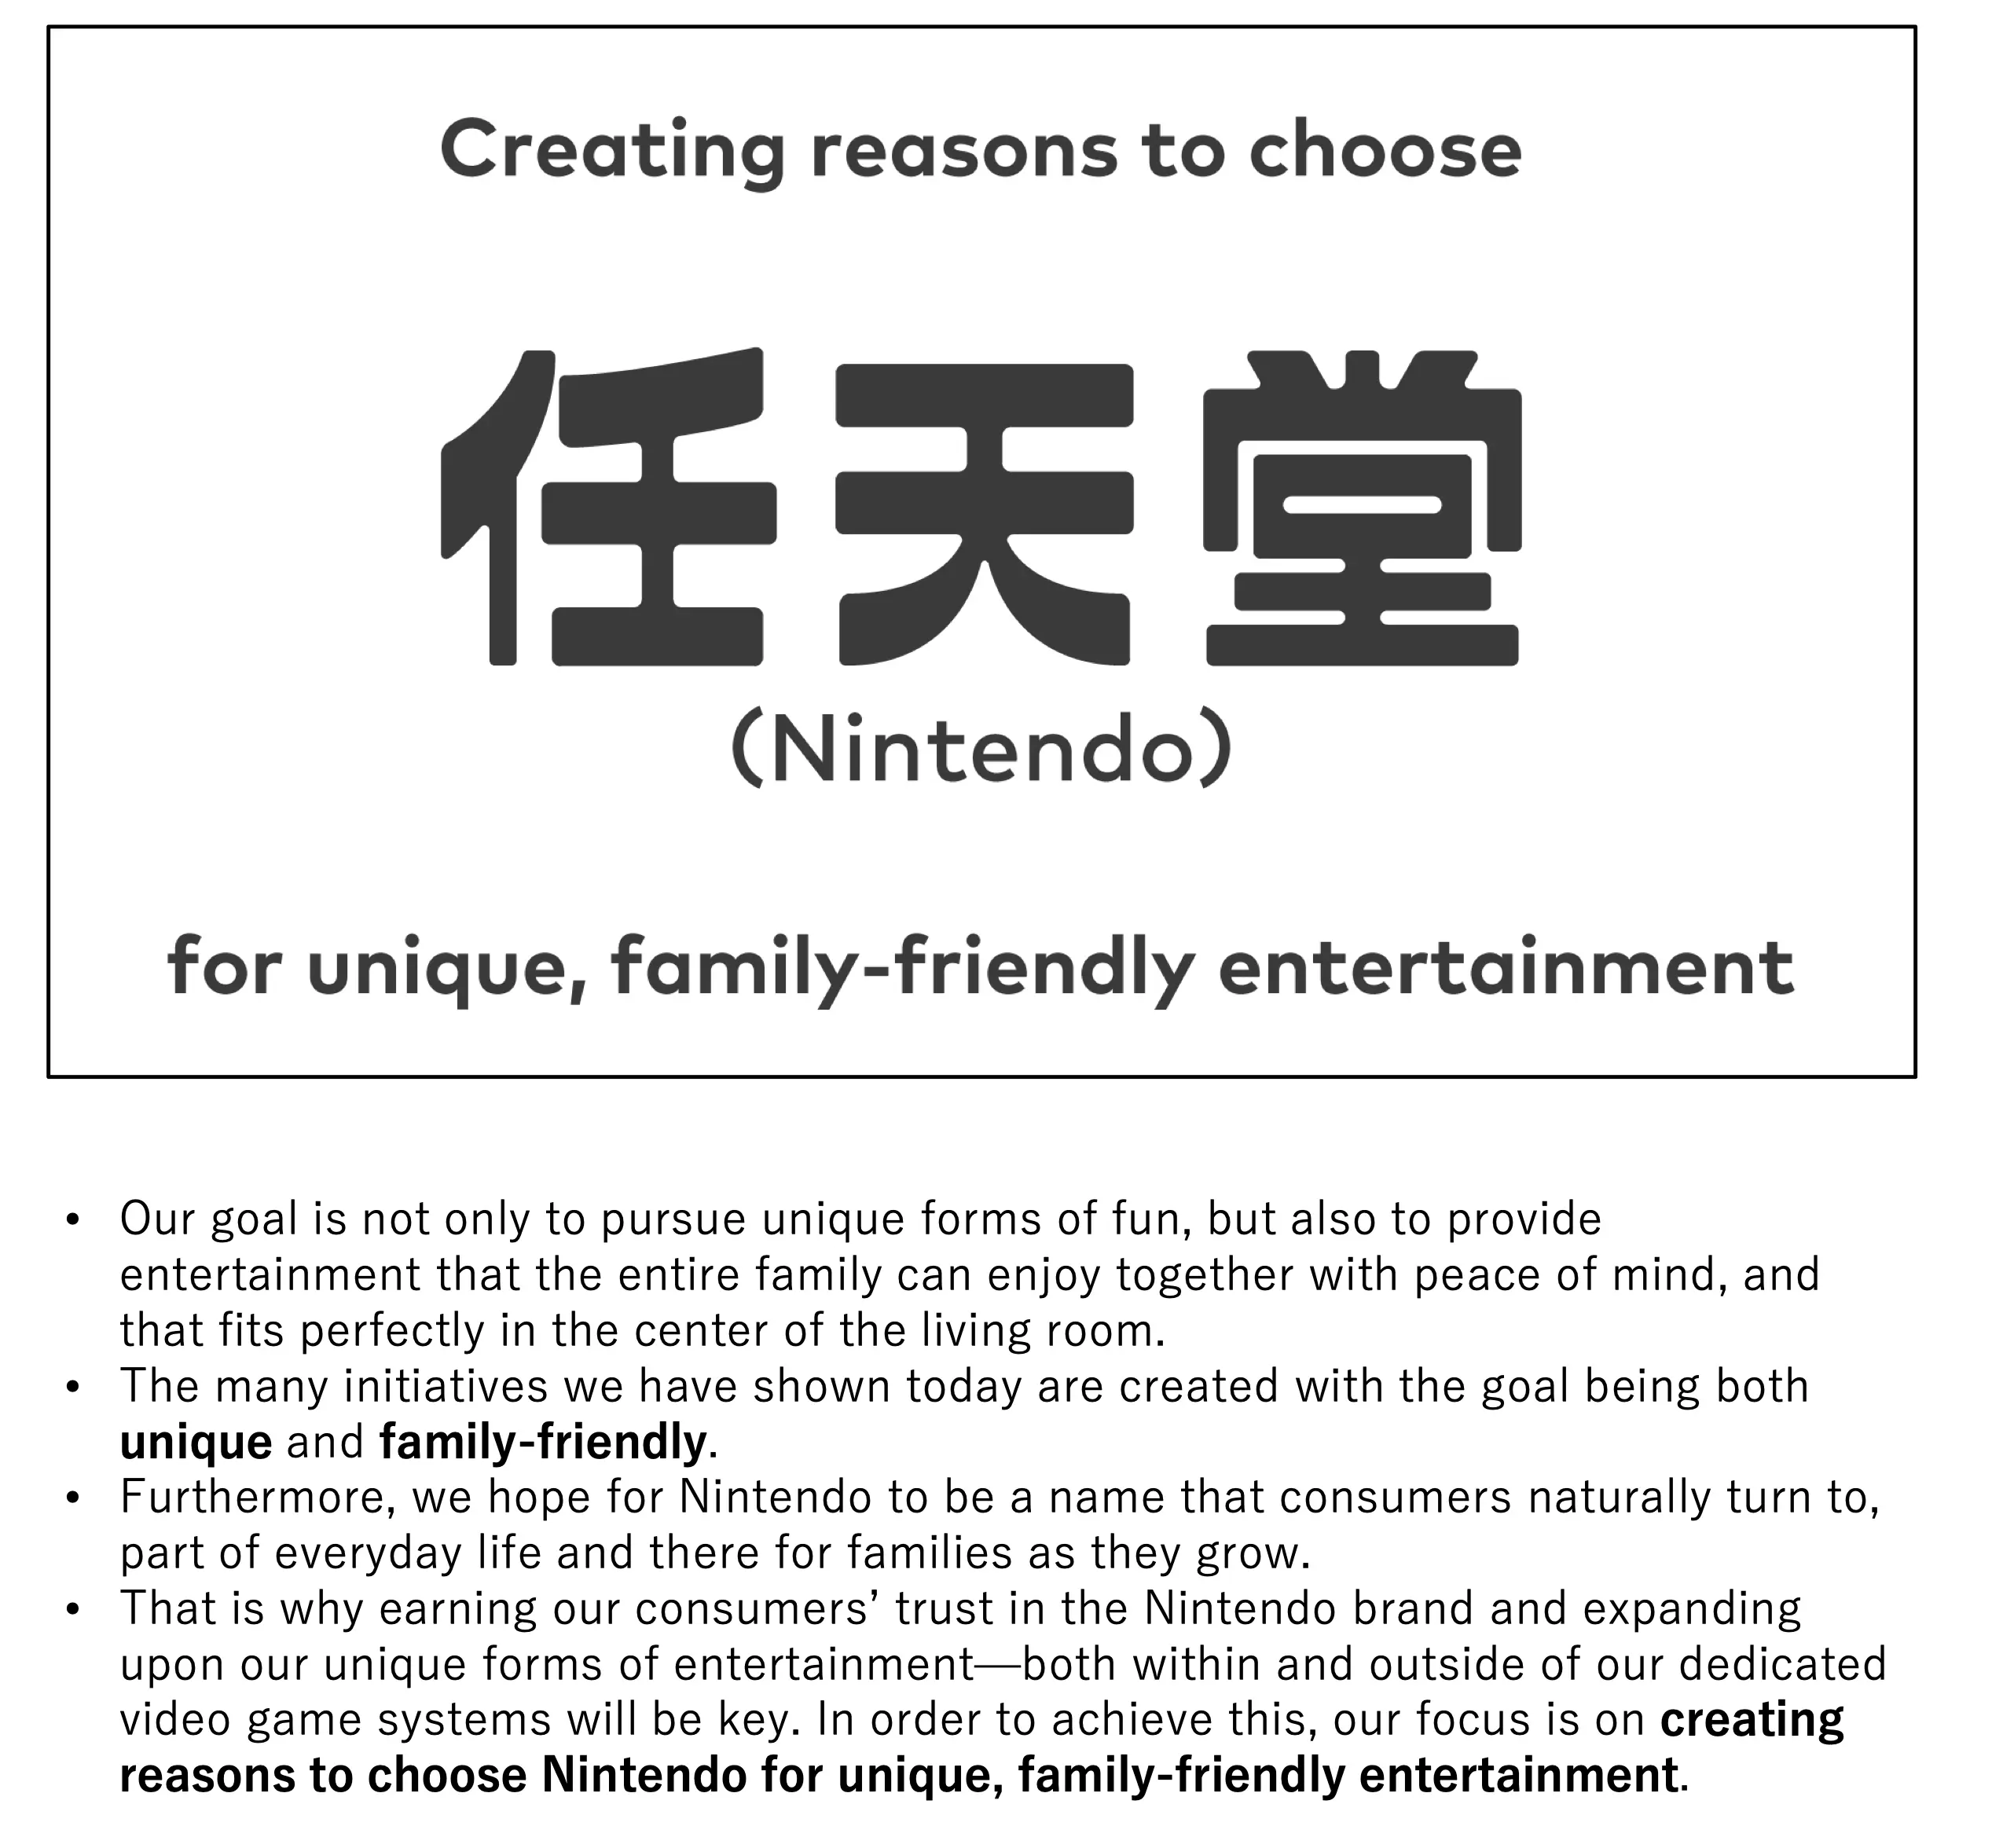
By being able to satisfy both audiences - adults and children - success in one generation of gamers, predicts success in the next generation.
Creative Culture
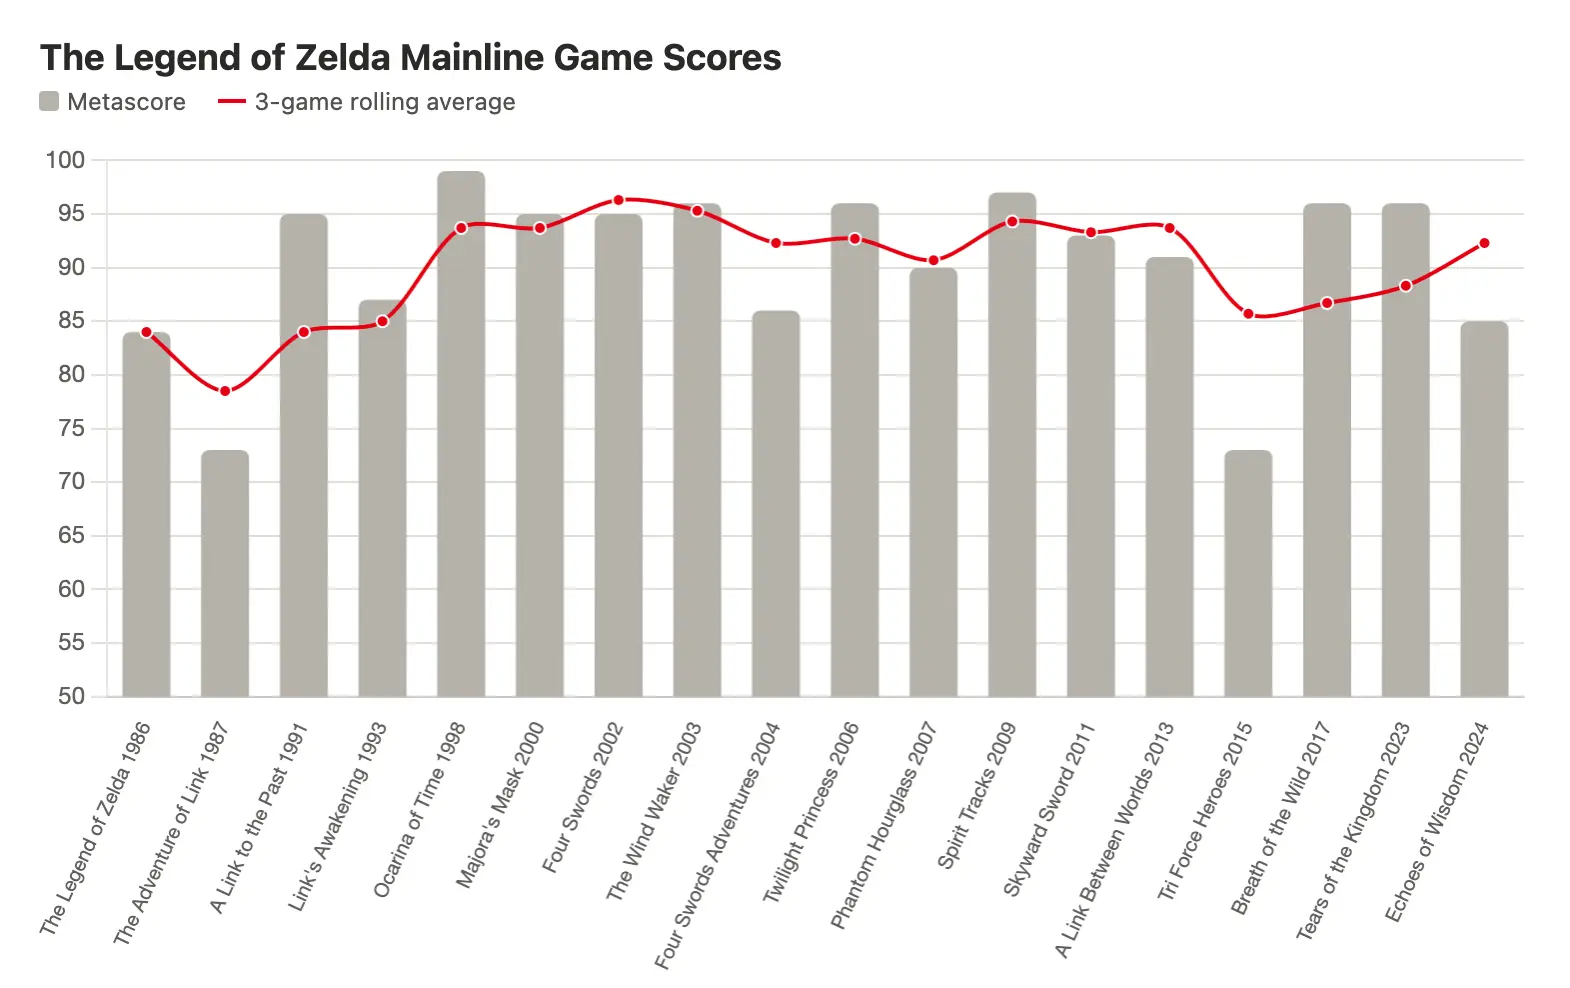
Many of Nintendo’s core IP (Mario, The Legend of Zelda, Donkey Kong, Starfox, etc.) were created by one person, Shigeru Miyamoto. Normally, this would create significant key-man risk as Miyamoto is now in his 70s. However, Nintendo has taken careful steps to practice deliberate succession planning. The best example of this is the continued excellence in metascores that The Legend of Zelda has received, even after directorial control was passed on to Eiji Aonuma years ago25.
Legend of Zelda Game Scores26
IP Enforcement
One of the most important qualities to see in a management team is that they understand their moat and that they take steps to protect and widen it. For a moat built on IP, this means taking legal protective measures. Undefended IP erodes brand value, risks overexposure or audience fatigue as unsanctioned reproductions satisfy audiences. One of factors that most contributes to the durability of Nintendo’s moat is the full pipeline control the company has over it’s IP and thus discretion over the cadence of releases. For example, a mainline Mario platformer games are only released every 4-6 years.27 In fact, a current threat to Pokemon is the explosion in popularity of fan-created content, named “ROM hacks”28. These are the result of Pokemon fans reverse-engineering the code base of old games in order to utilize the assets and create and share their own version of games for free within the community. The quality of these games varies widely, but on a fundamental level, they effectively provide an unlimited pool of novel Pokemon content for free. There is a very real threat that nostalgic fans of Pokemon choose to get their kicks of these games rather than official Pokemon games on the Switch 2.
In fact, Nintendo has been incredibly aggressive against pursuing DMCA take downs and legal action against emulation and pirating of their IP.29 This has been to the point that it has actually become controversial to the core fans who see their work as hommage to Nintendo’s art and not alternatives to the main games. While it is not the place of this report to judge the proper extent to which legal action should be legally pursued, it would be reassuring for an investor of Nintendo that they take it so seriously. It would likely be worse for Nintendo if the IP of Pokemon or Mario was damaged than if some fans are upset about not being able to make their own games from Nintendo’s assets.
Cost Advantages
Operating Cost Advantages
Advertising % of Revenue - Nintendo vs. Competitors:30
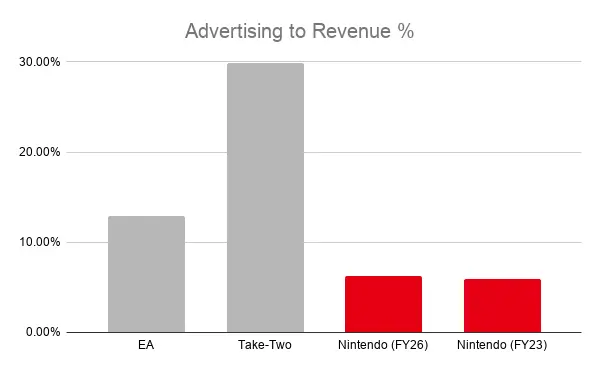
Nintendo spent roughly 6% of revenue on advertising in fiscal 2026 and about 5.8% in fiscal 2023, against EA’s approximately 13% and Take-Two’s approximately 30%.
This is a direct demonstration of the strength of Nintendo’s IP. Both competitors were selected because they themselves have strong IP - EA with EAFC (formerly FIFA), for example, and Take-Two with the GTA series, Red-Dead Redemption, and more. Regardless of whether Nintendo is in a console launch year, or a regular mid-cycle year, a new Mario or Zelda entry is so beloved and culturally relevant that the game alone performs the demand-generation work a media budget would otherwise have to buy.
R&D to Revenue - Nintendo vs. Competitors:31
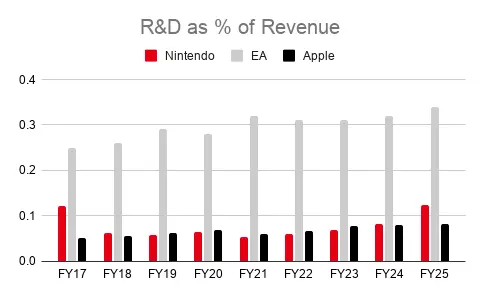
Nintendo’s R&D intensity has run in roughly a 6-12% of revenue range across fiscal 2017 through fiscal 2025, spiking to around 12% in both fiscal 2017 and fiscal 2025 which are the two years bracketing a hardware-transition R&D ramp (Switch’s 2017 launch cycle and Switch 2’s development-heavy pre-launch year), set against a temporarily smaller revenue base.
Even at that cyclical high, Nintendo’s ratio sits well below EA’s, which has climbed steadily from roughly 25% to roughly 34% of revenue over the same stretch. EA is funding an escalating graphical fidelity and live-service arms race that consumes a rising share of every revenue dollar, while Nintendo’s R&D burden has stayed roughly flat as a share of revenue even through its own console transition.
Tellingly, Nintendo’s R&D intensity tracks closer to Apple’s (roughly 5-8% of a vastly larger revenue base) than to a fellow games publisher’s. This again shows the similarity of the businesses, and how Nintendo behaves more like a disciplined hardware company protecting margin than like a content studio caught in a production-cost spiral.
Revenue per Employee - Nintendo vs. Competitors:32
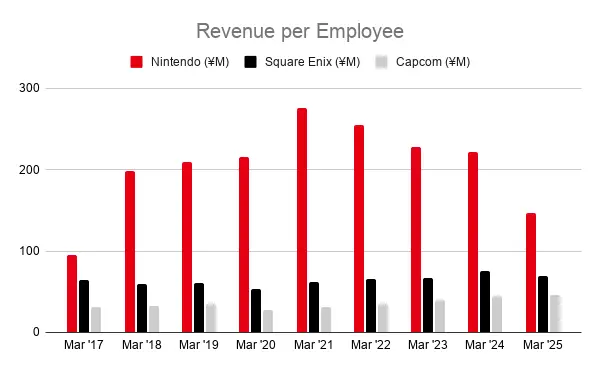
Nintendo has generated somewhere between roughly 2x and nearly 4x the revenue per employee of Square Enix and Capcom in every year of the sample.
The improvement of the gap at the trough, is the most important observation. Again, we are in a period where development costs are soaring and the number of employees needed to make games has expanded dramatically. The persistent gap is a demonstration of how Nintendo has largely avoided the live-service permanent-team model, and gets outsized per-employee economics from evergreen franchises that don’t need to be rebuilt from scratch each console cycle the way a typical publisher’s back catalog does.
Underpowered by design
Nintendo does not compete on hardware cost leadership. The console is deliberately under-spec’d relative to Sony and Microsoft to hit a lower price point and preserve margin, a strategy that has worked for multiple consecutive console generations.
This is actually a key strategic advantage for Nintendo. In 2026, the video game industry has been in a genuine capital-cycle reckoning: roughly 45,000 jobs were eliminated industry-wide between 2022 and mid-2025, and the 2026 GDC State of the Game Industry survey found a third of American game workers had been laid off in the prior two years, rising to two-thirds among triple-A studio staff specifically.33. At the time of writing this report, on July 6th 2026, Microsoft-Xbox has announced major restructuring activities.34 It is my view that this is the textbook back-half of an overexpansion cycle, coupled with rising development costs due to the availability of powerful PC and console hardware that tempts developers into making massive, costly games.
The Capital Cycle, per Capital Returns:
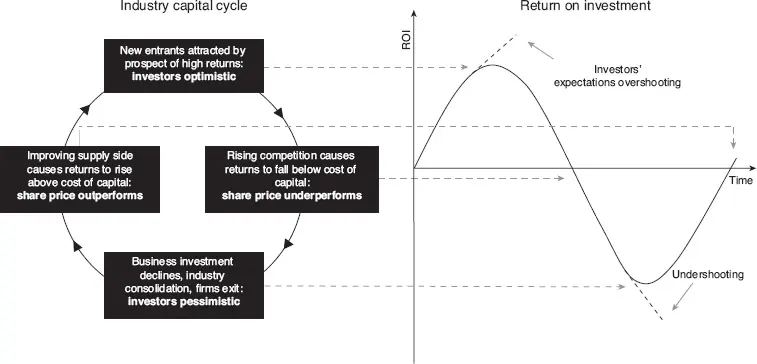
In 2021, when the pandemic trapped people in their homes, a surge in demand, coupled with cheap capital, incentivized publishers to invest massively. When the pandemic receded and interest rates normalized, the industry faced a glut of supply against falling demand, and in 2026 the industry is still working off that glut.35
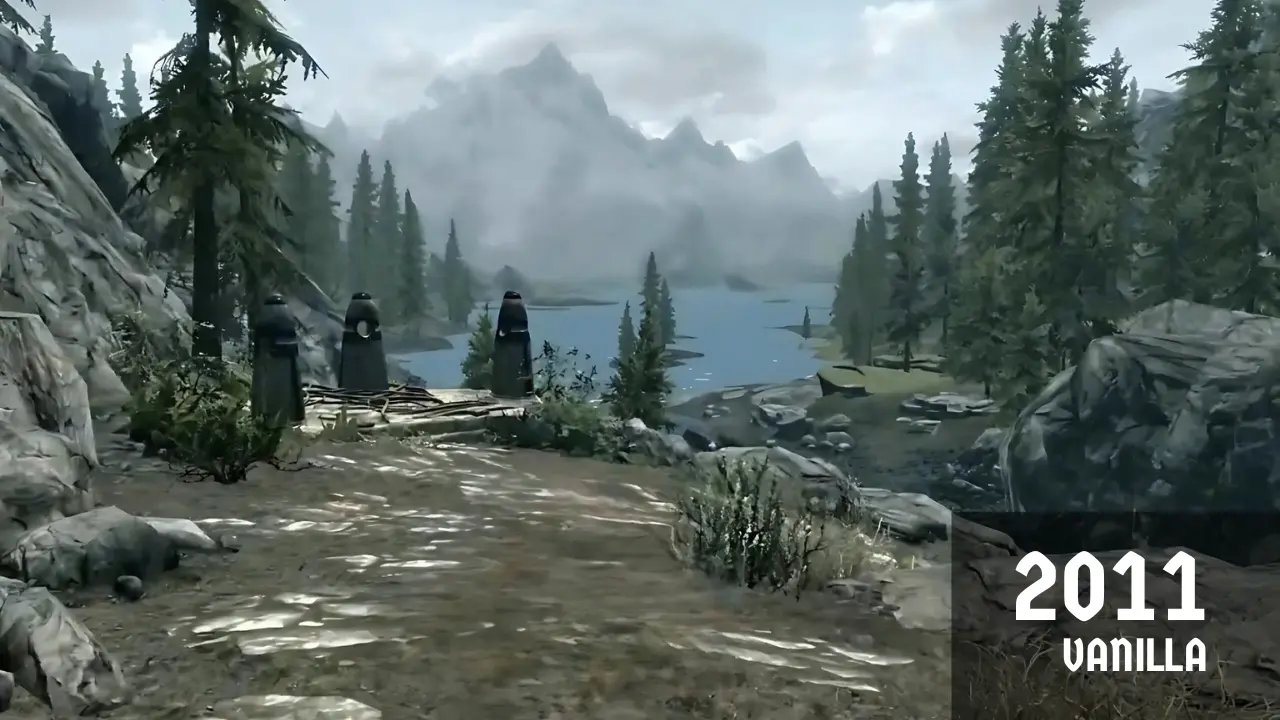
However, while normalized demand and rising rates have acted as a trigger, my opinion is that structural cost increases across the industry are also at play. Triple-A development budgets have exploded since 2022, mainly driven by increased staffing requirements needed to produce the insanely high-quality detail required by games that aim to achieve real-world graphical fidelity on modern hardware.36 The desired realism of these games means that simple items, like a bush, can no longer just be an abstraction of a bush that asks the user to imagine the detail, but must actually provide that detail by rendering every individual branch and leaf, plus the complex physics that govern how those leaves move in the wind. Extrapolated across continent-sized game maps, it is no wonder that staffing requirements and development timelines are putting pressure on margins.
For a comparison of how far graphics have come, see below. The first image is a screenshot from the Triple-A game “Skyrim,” released in 2011 (credit to Reddit user No-Leek7262).37 The second is a screenshot released by Rockstar Entertainment, developer of the soon-to-be-released Grand Theft Auto VI.
The Elder Scrolls V, Skyrim - Graphics, 2011:
GTA VI Graphics, 2026:38
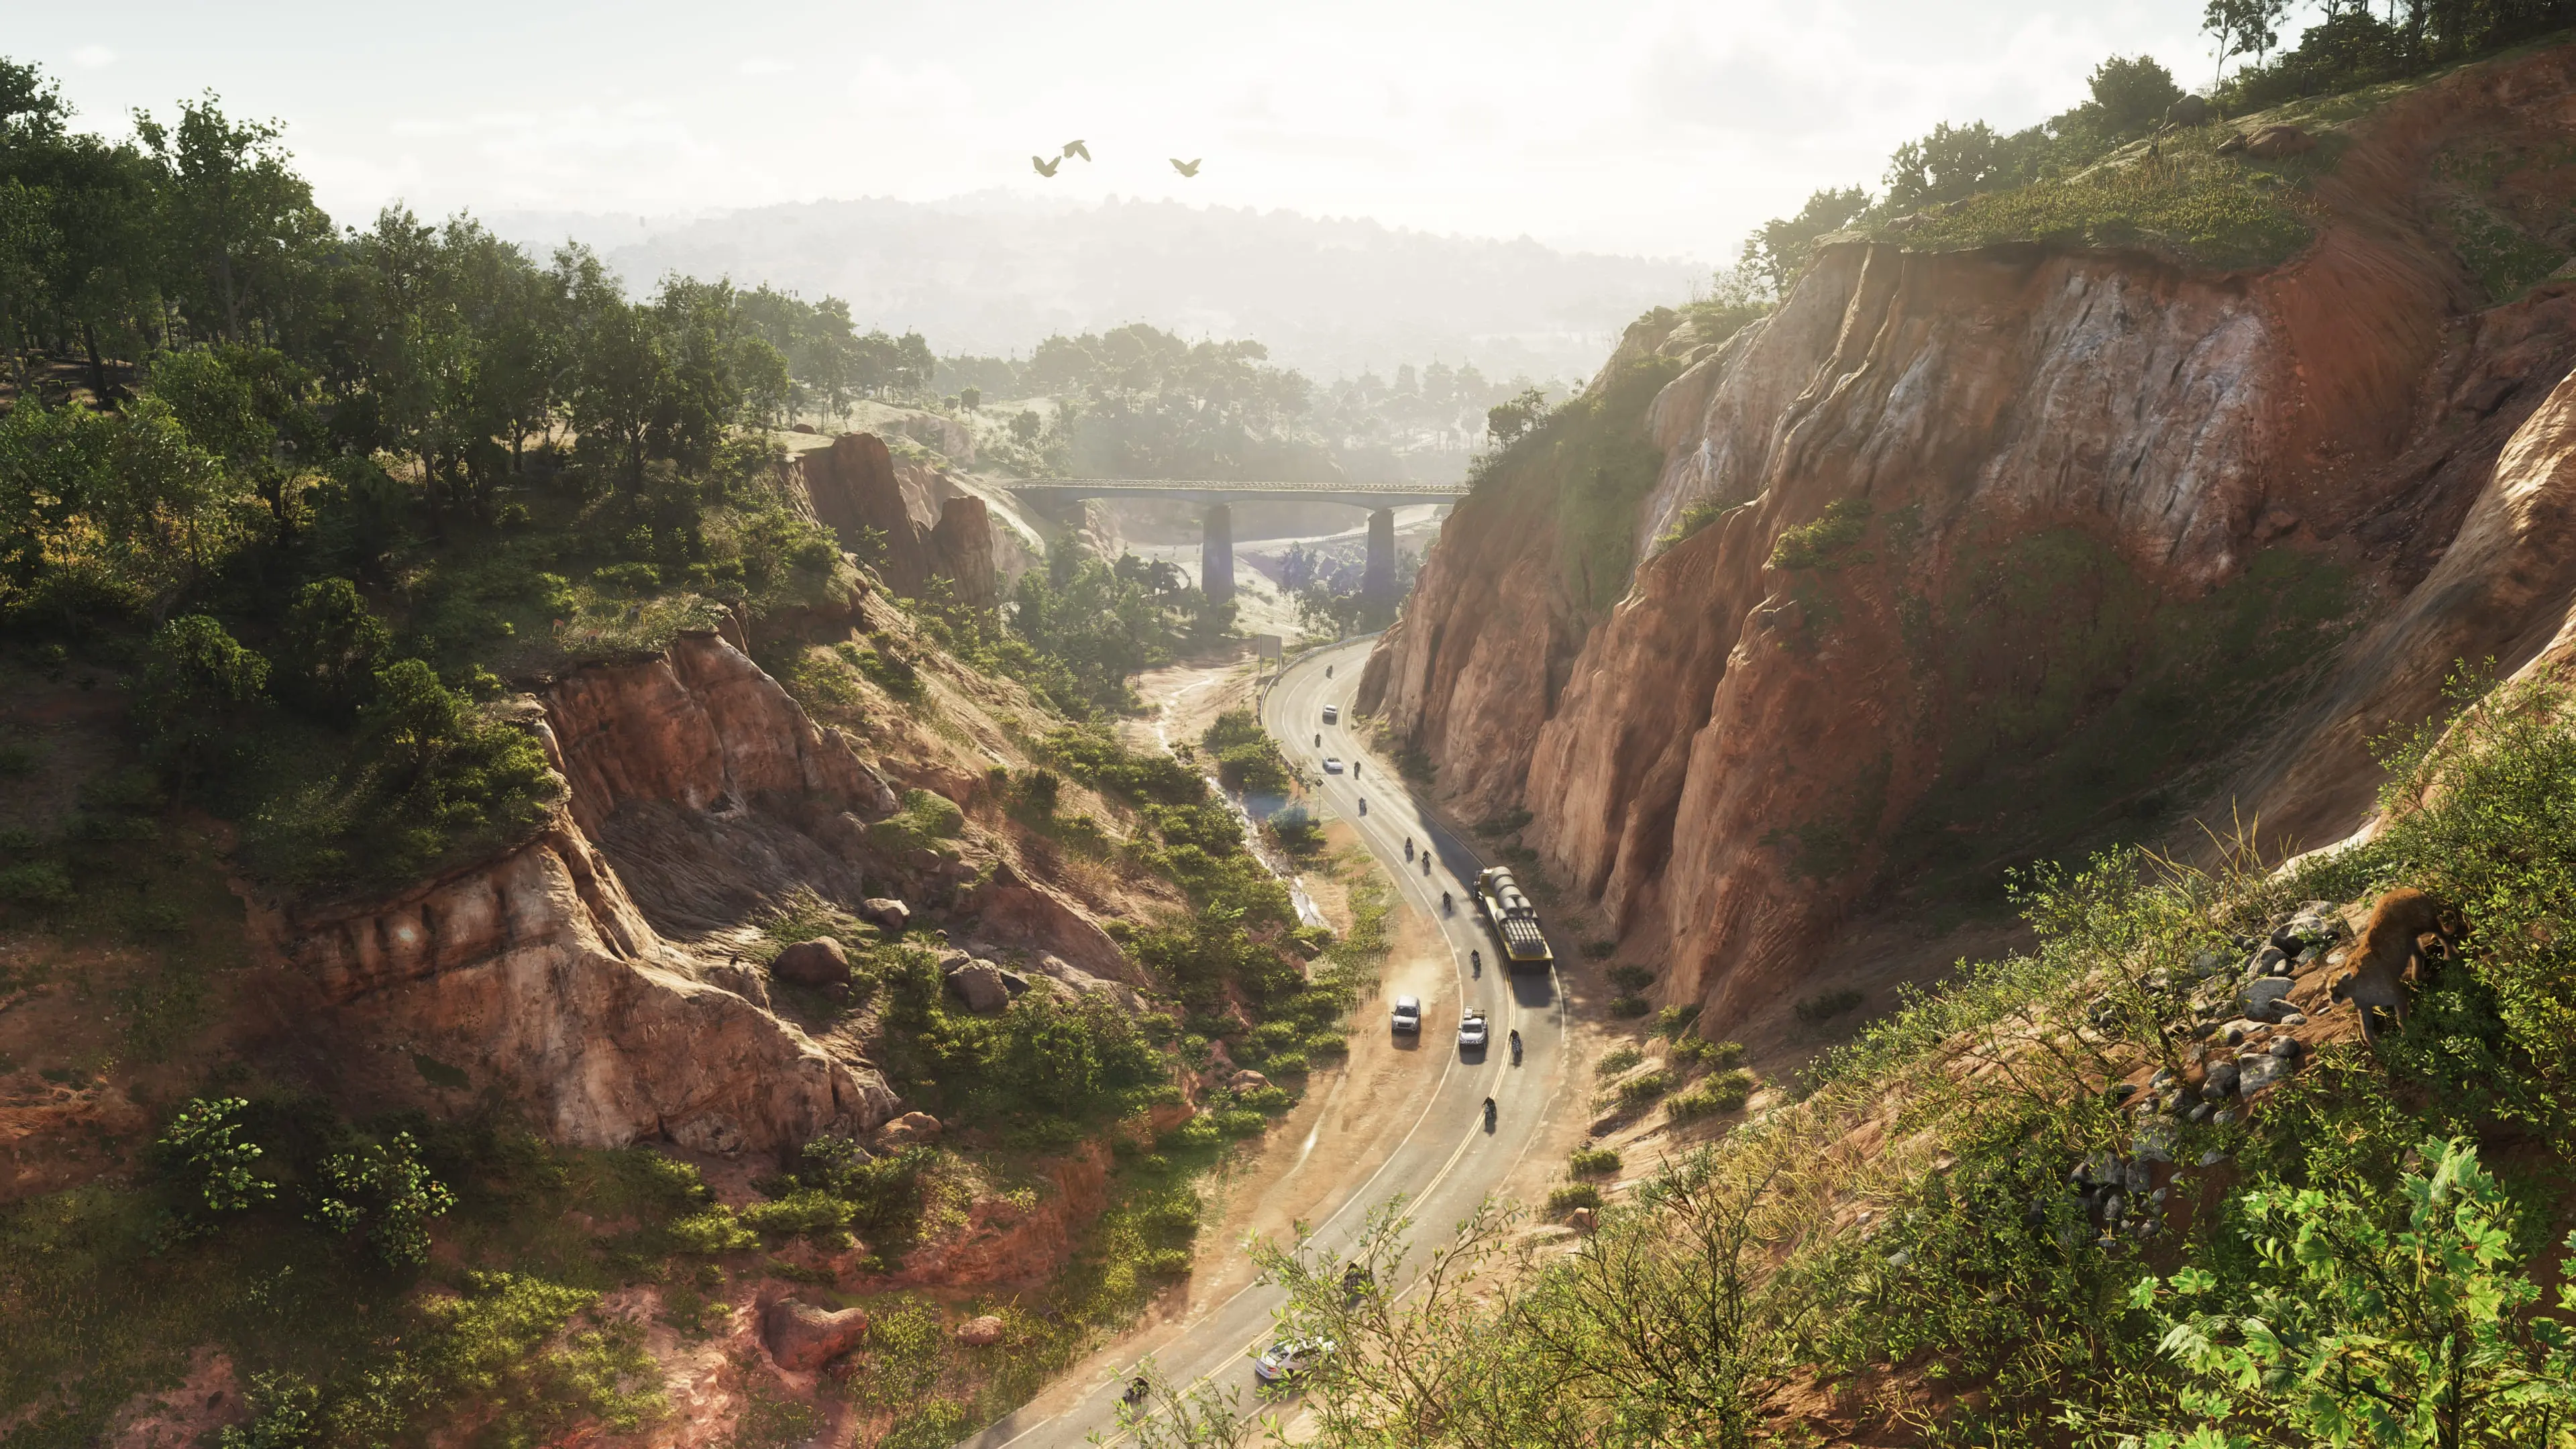
The expansion of what games can be has led to an enormous swelling in the cost of what it takes to create one. These triple-A games now take 5, 7, even 10 years to develop. The budget of Grand Theft Auto VI, expected to release in Fall 2026, is estimated to have exceeded a billion dollars. With costs this high, it is far more difficult for developers to turn a profit, and the only likely long-term outcome, in my opinion, is a major rethinking, by the industry, of what a game should be.
In capital-cycle terms, the industry broadly sits in a “capital exiting, supply contracting” quadrant, which is historically the point in the cycle where returns for the disciplined survivors start rising back above the cost of capital, precisely because competitors have destroyed capital rather than deployed it well. Nintendo is the disciplined survivor. It is one of the few companies in the sector positioned to harvest the cleared field rather than being part of the wreckage.
Set against that backdrop, Nintendo’s strategy looks less like frugality and more like foresight. Nintendo never entered this arms race in graphical fidelity. The Switch 2, like its predecessors, is built on mature, lower-cost components, which are not only a cost advantage that allows Nintendo to turn a profit on its consoles, but also act as a ceiling on the fidelity its first-party studios need to achieve. This, in turn, functions as a limiter against the AAA cost inflation discussed above.
Nintendo’s advantage, however, is not that it refuses to play the game. The is a management choice, not a moat. It is that it never played the game. This is the key point. Nintendo’s customers do not expect cutting edge performance graphics, The Switch 2 is meaningfully more powerful than the Switch 1, yes, they can’t fall too far behind. But in the technology industry, swimming in the wake of the bleating edge is materially cheaper and more sustainable. As long as your customers don’t expect you to deliver cutting edge performance, being able to swim in that wake permanently is a competitive advantage.
The rest of the industry, whatever remains after the purge, will inherit a more favourable competitive landscape, but must still chase ever-more-impressive graphics, because that is what their customers expect. The next Elder Scrolls, Grand Theft Auto, even Call of Duty, cannot go backwards in graphical delivery without majorly disappointing their user base. Nintendo, even as its own headcount and development costs have risen, can focus on where it’s real strength comes from: fun and innovative games. That is what makes this a genuinely durable advantage and not just cost discipline dressed up as strategy. It is the relationship with the customer, and the expectations that relationship carries, compared to what the competition faces.
Is This Really A Moat?
None of this is really a pure cost advantage story in its own right. Advertising spend is low because the IP itself generates demand. R&D stays contained because the IP doesn’t require constant fidelity escalation to remain compelling. Revenue per employee is high because a comparatively small workforce controls assets on evergreen franchises. Each efficiency metric here is downstream of the IP moat, not an independent source of advantage. That has two divergent implications: it means the cost advantage should be very durable for as long as the IP itself stays culturally relevant, but it also means these three metrics would likely normalize toward peer levels together, not independently, if that underlying moat ever weakened.
Network Effects & Switching Costs
Network effects and switchings costs are the weakest leg of Nintendo’s moat and the investor would not be wrong to largely ignore them in their investment thesis. However, it is worth understanding them, as these are areas where Nintendo’s competitors do have advantages, and where Nintendo could strengthen its business.
The traditional network effects of social media don’t exist on Nintendo’s core business. Mario doesn’t get more valuable because more people play Mario. What does exist is an indirect version via the eShop: a larger install base gives third-party developers more reason to target Switch, which produces more games, which gives buyers more reason to purchase the console.
Fundamentally, the Switch 2’s third-party lineup is materially stronger than the original Switch’s at the same point in its life. Cyberpunk 2077, Devil May Cry 5, Final Fantasy VII Rebirth, Hogwarts Legacy, and Assassin’s Creed Shadows are all live on Switch 2 already, a lineup the original Switch didn’t approach until several years into its run.
Nintendo Switch 2 Selected Titles:
That’s real evidence the flywheel is turning faster this cycle. But it depends entirely on hardware being powerful enough to port to. The Switch 2 is meaningfully more powerful than the Switch 1, which means some of the most popular games of all time - Cyberpunk, Eldin Ring, etc. all play well on the system. For the most dedicated gamers, maybe it’s not enough, but for most people the performance on these games is good enough.
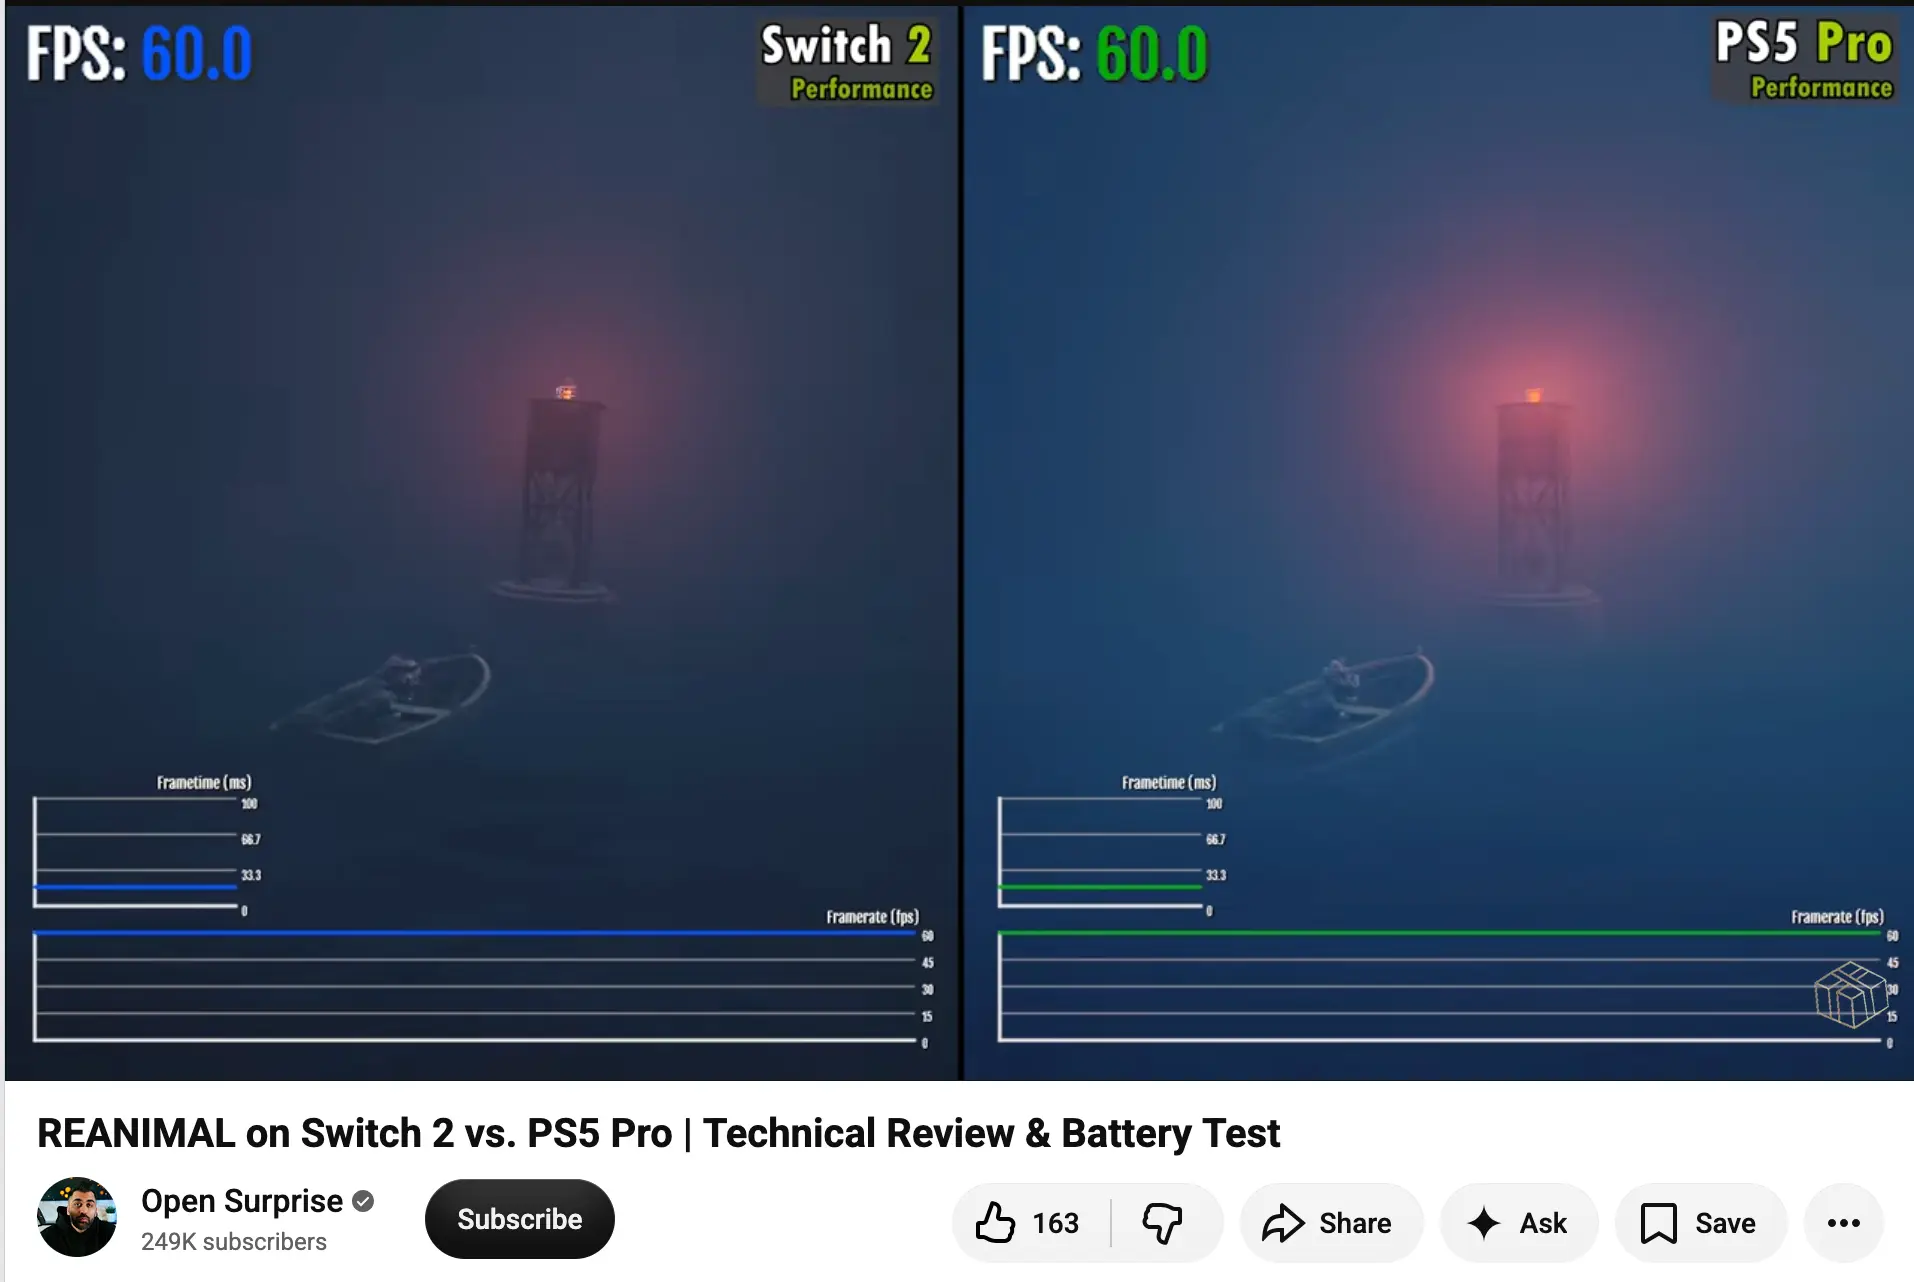
The issue, however, is the same as always for Nintendo. Gaming demands don’t stop and it is unlikely that newer games are able to run as well on the Switch 2 as they do on more powerful hardware. The same underpowered-console choice that produces the cost advantage described above also caps how far this network effect can compound.
Simultaneously, the Switch platform struggles on network effects against Playstation, Xbox and PC because it doesn’t have a meaningful social graph. Competitive gaming lives almost entirely elsewhere: Fortnite, Call of Duty, and League of Legends are the dominant social and competitive titles among teens, none of them meaningfully present on Switch. Teenagers who game socially have a real, structural reason to choose a competitor.
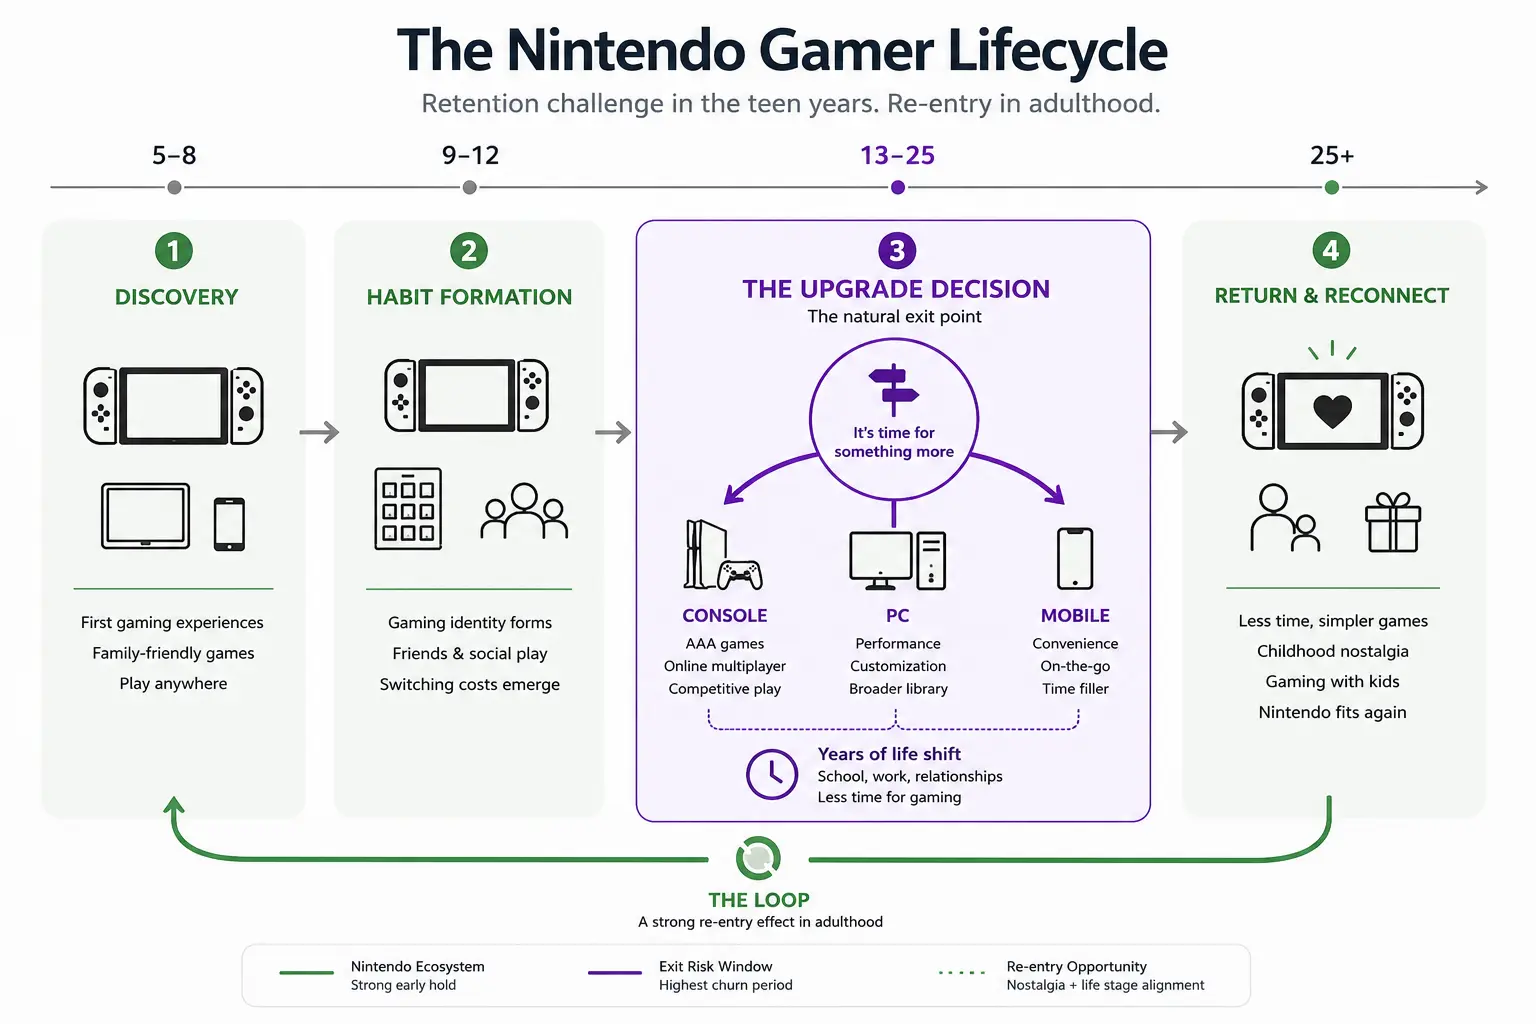
This lack of network effects in turn lowers the switching costs for gamers to move to other platforms, and creates what I think of as the Nintendo Gamer Lifecycle, described below.
Pricing Power
Like the cost advantages discussed above, pricing power here is a downstream consequence of the IP moat rather than an independent source of it. But it shows up clearly enough in the data that it deserves its own look rather than being folded into the IP discussion.
It must be understood going into this discussion that games usually do not have a long shelf-life. According to an analysis performed by vaulted games, top-rated AAA titles, on average, hits their first discount within about two months of release and reaches 33-50% off by the six-month mark. Nintendo’ first-party titles, on the other hand, typically take six to twelve months for even a modest markdown and rarely exceed 33% off even then. 39 Where this becomes materially apparent is when we look at the price history of core Nintendo games against core Playstation games side-by-side.
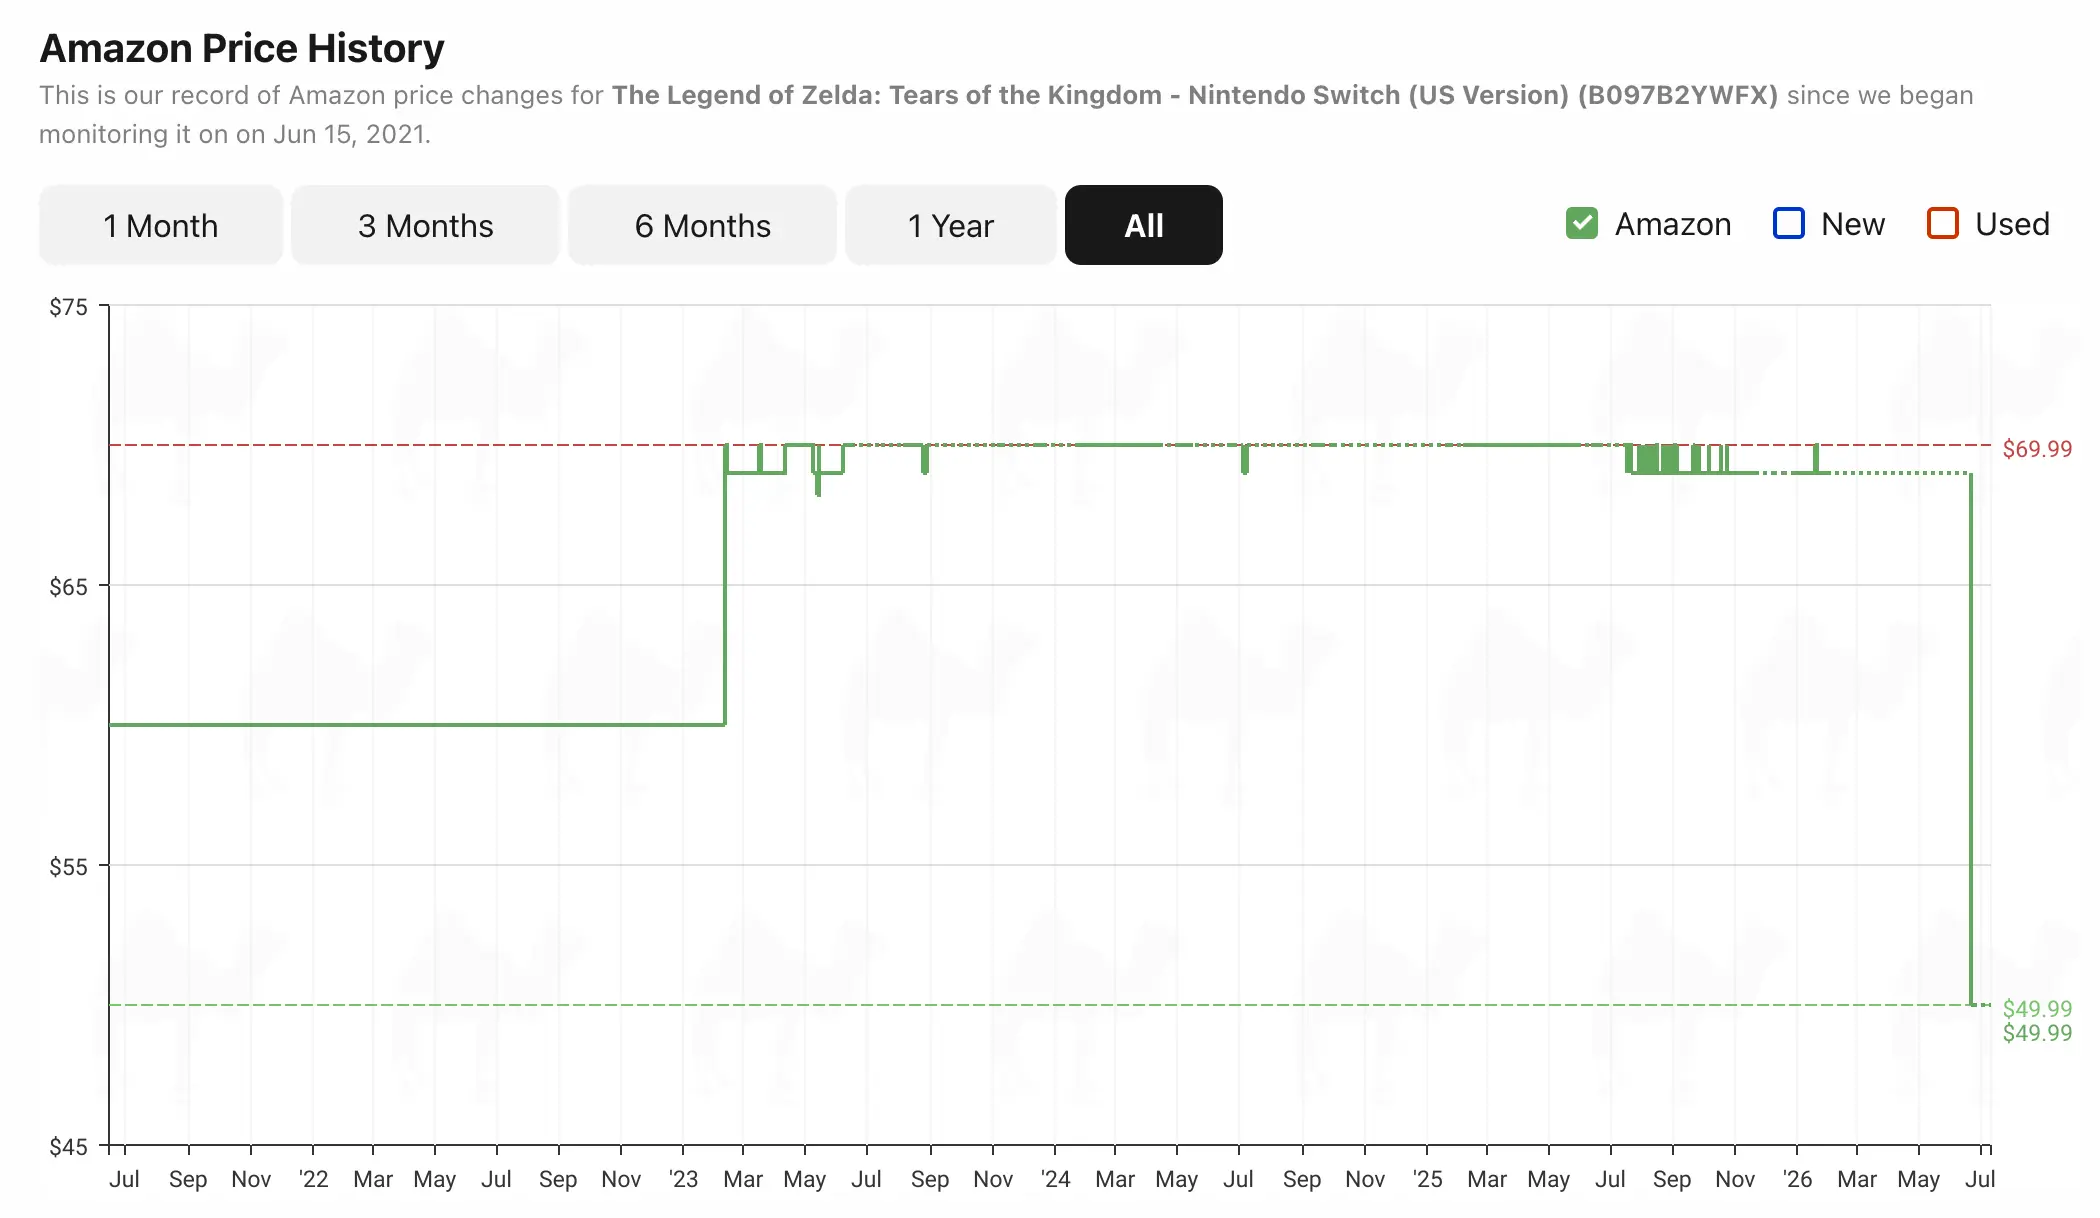
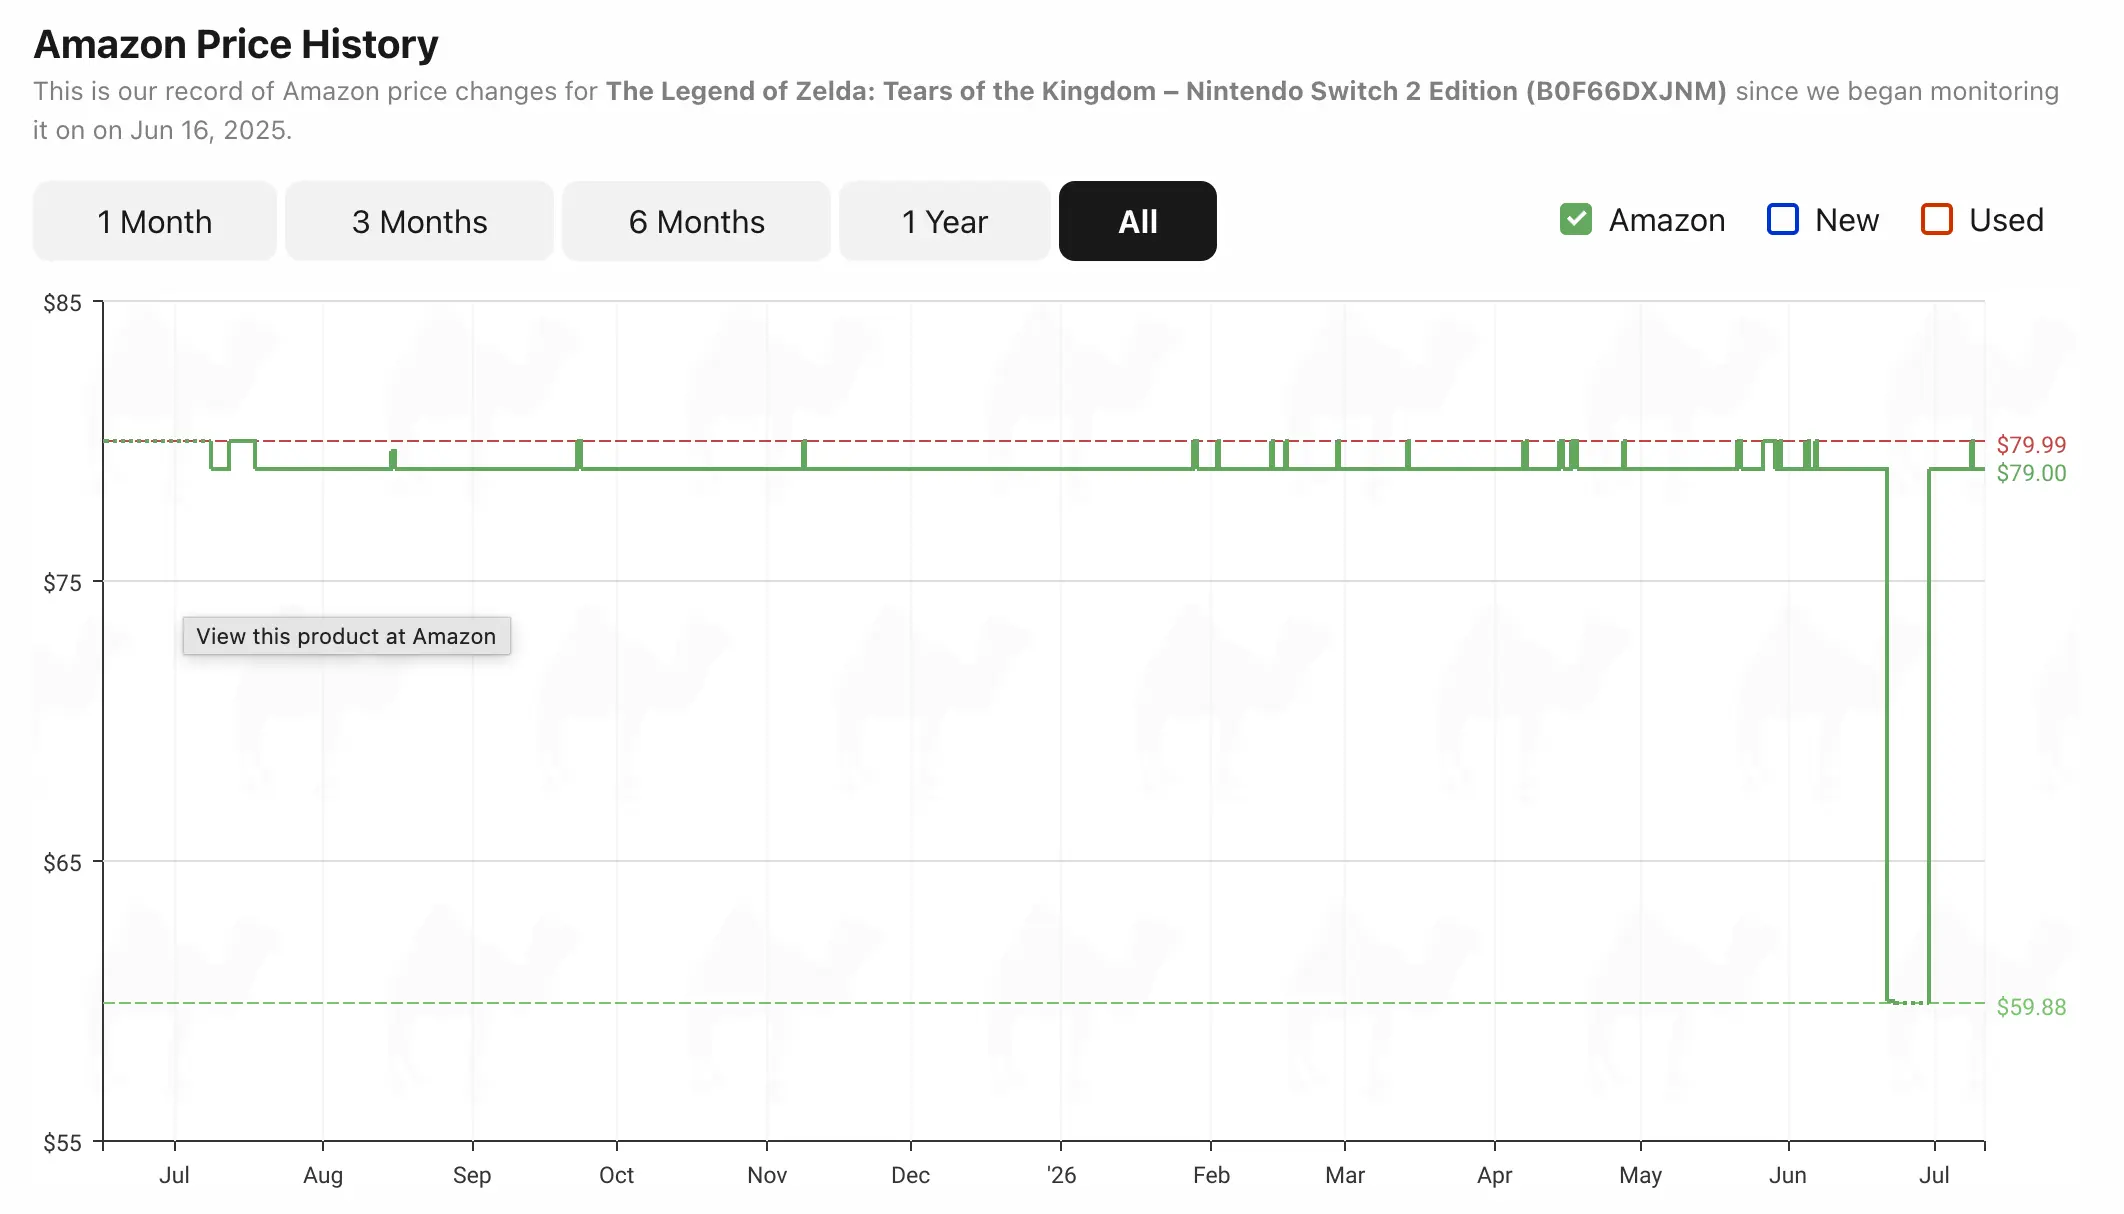
“The Legend of Zelda: Tears of the Kingdom” is one of Nintendo most hyped, and best selling games in recent years. We can see from the chart below that after being launched in 2023, the game received essentially zero discounting across the following 3 years, until months after the launch of the Switch 2. From that point on, the Switch 2 version of the game also did not experience any major discounting for another year.
As an aside, I’m not sure why this chart from CamelCamelCamel contains data going back to 2021. There may be some contamination of data from Legend of Zelda: Breath of the Wild.
Legend of Zelda: Tears of The Kingdom Price History (Switch 1):40
Legend of Zelda: Tears of The Kingdom Price History (Switch 2):41
The best comparison I can think of for Playstation is their title “God of War: Ragnarok”. It is a Sony first-party exclusive, extending a franchise that has existed since 2005.42 It is available with full text and audio in almost every major language, it has over 200k ratings on the Playstation store alone, and it’s average rating is 4.8/5.43 It is by all measures an excellent game and the closest thing Sony has to a home-run. Yet, after launching in 2022 for $70, it was already selling at over 50% off within a year, and was permanently repriced to roughly half its original MSRP within about twelve months.
God of War: Ragnarok (Playstation 5):44
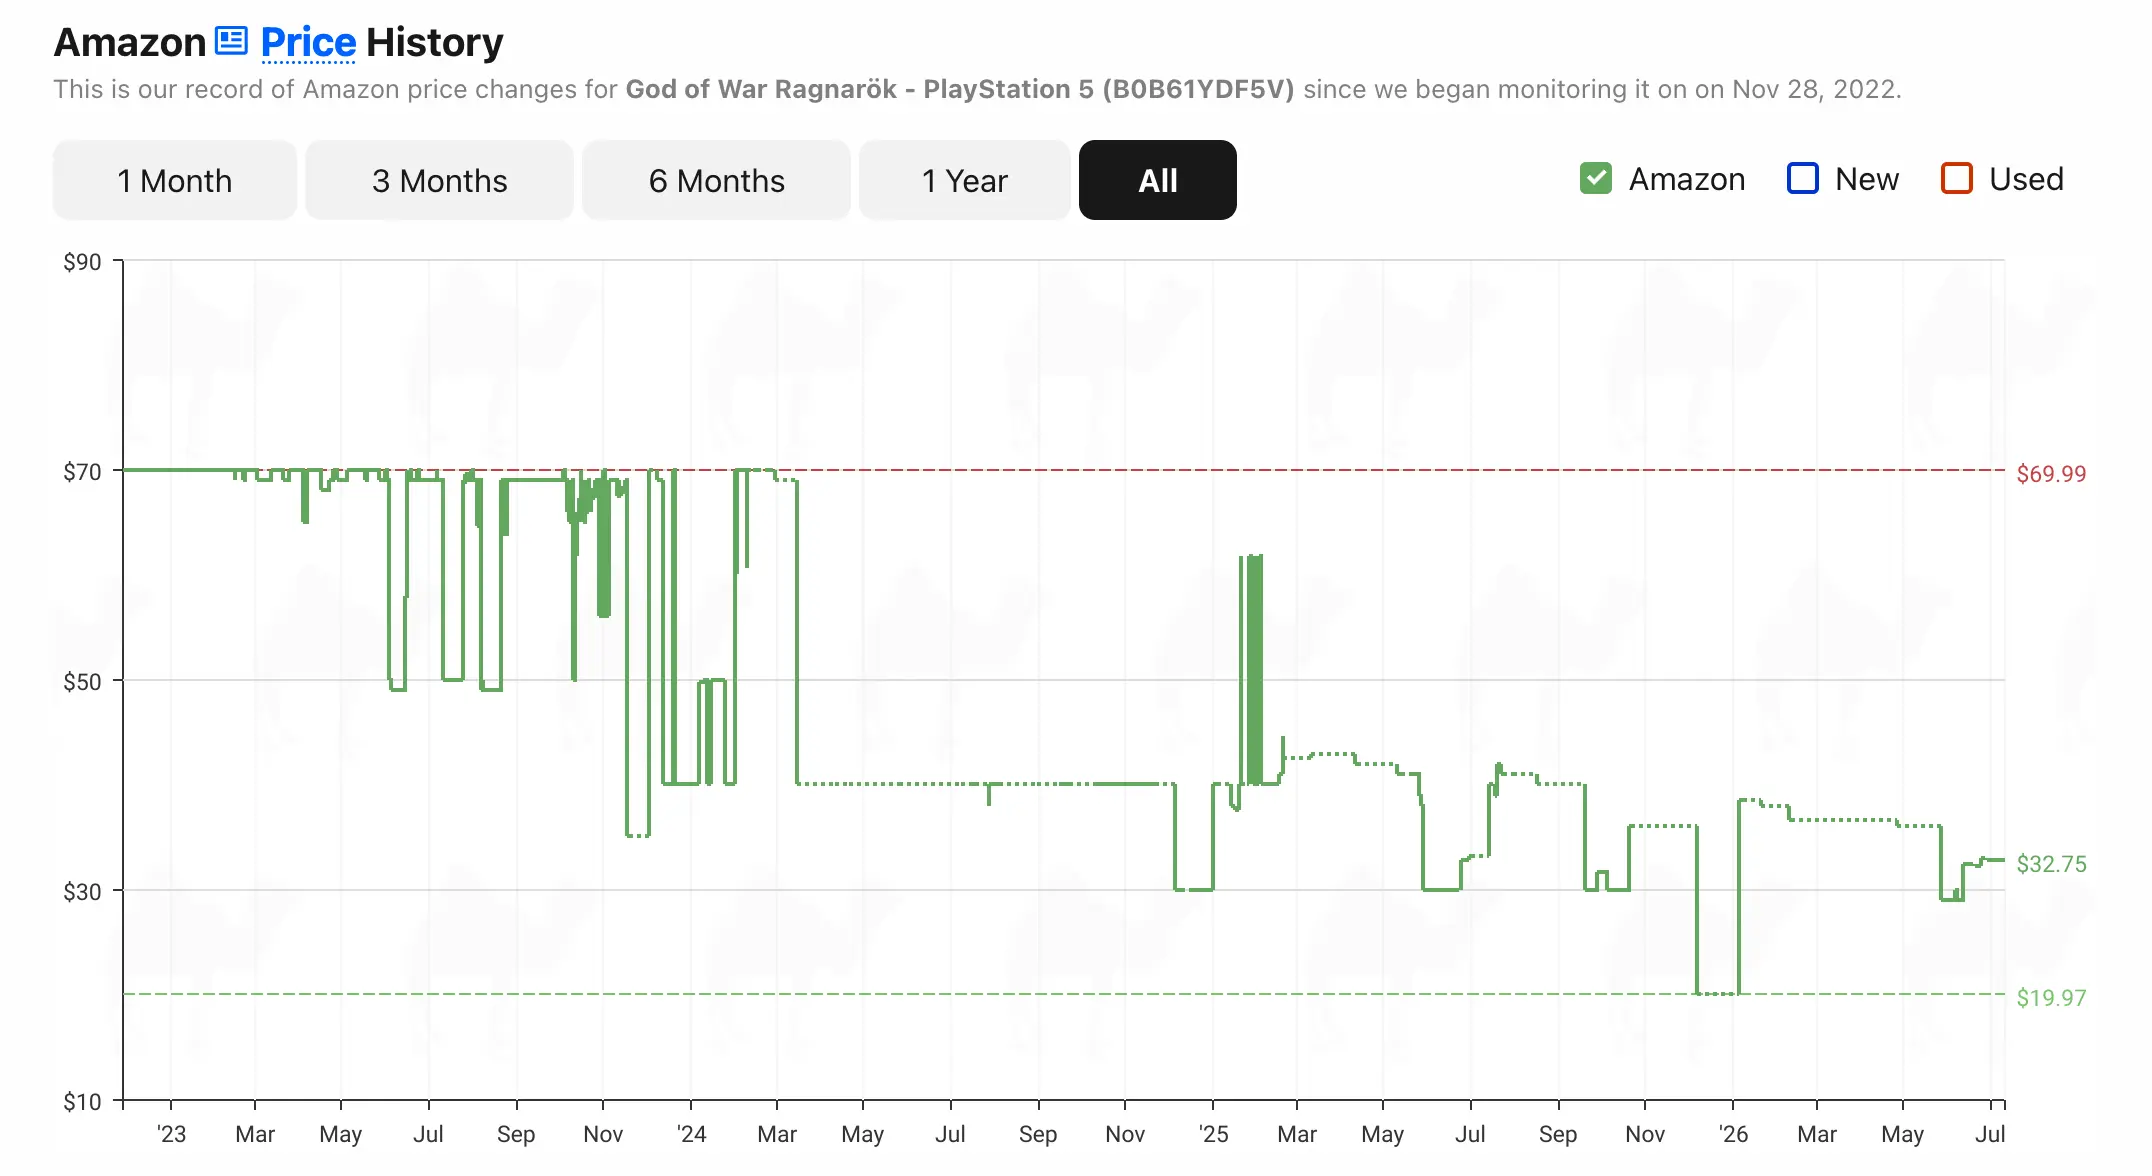
What matter here is that this is not Sony failing to execute. This is the state of normalcy in the gaming industry for all players - except Nintendo. The difference is almost half a decade of sales at full margins, versus running as fast as you can to stay in one place. It is a good of a picture as we can get of the pricing power Nintendo holds and the power of its IP.
5. Risks & Opportunities
Risks
The risk section ahead will not attempt to predict or discuss short term risks to Nintendo’s business. This includes broader industry pressures, such as the current spike in digital memory that is driving price increases on many electronic products. 45 Instead, it will take a long term perspective. We will view the business as owners would and we’ll try to identify what could go wrong. Specifically, what series of events, if they played out, would turn today’s investment into a permanent loss within 10 years?
1. Solvency Risk
Nintendo Net Debt (FY17-FY26):
As discussed in the balance sheet health section above, Nintendo carries over ¥2.2 trillion in net cash. This is roughly equivalent to $14B USD and almost 25% of the company’s market cap. Financial distress is not a real scenario and is not worth further discussion.
2. Earning Power Risk
With that in mind, the fundamental risk Nintendo faces is a permanent decline in earning power. The moat, discussed above, slowly eroding. Given that moat is built on the company’s IP, I see two major risks that could disrupt Nintendo’s earning power in 10 years time.
The Gamer Lifecycle Breaks Down
Nintendo’s gamer lifecycle, and the durability of the business, depends on core franchises being introduced to each new generation of gamers, so that they form nostalgic bonds with those characters and games. If children stop arriving at Nintendo as their first serious gaming experience, then the renewal mechanism reverses. Nintendo would still be able to sell games, and would appear successful for many years, especially as the cohorts already served enter their strongest earning years as adults. But with that cohort not being replaced at the bottom, Nintendo’s customer base would face a long, slow hollowing out.
Nintendo Age Distribution, 20236
As discussed above, although Nintendo did share age demographic data in 2023, it is difficult to draw any major conclusion from the data alone, since this is Nintendo Account data, not actually gamer data. Parents are likely to create accounts for their children, who then play on the device. That said, at face value, this data would suggest that the majority of Nintendo’s customer base are adults, and that the children’s cohort is not of significant size to replace them in ten years’ time.
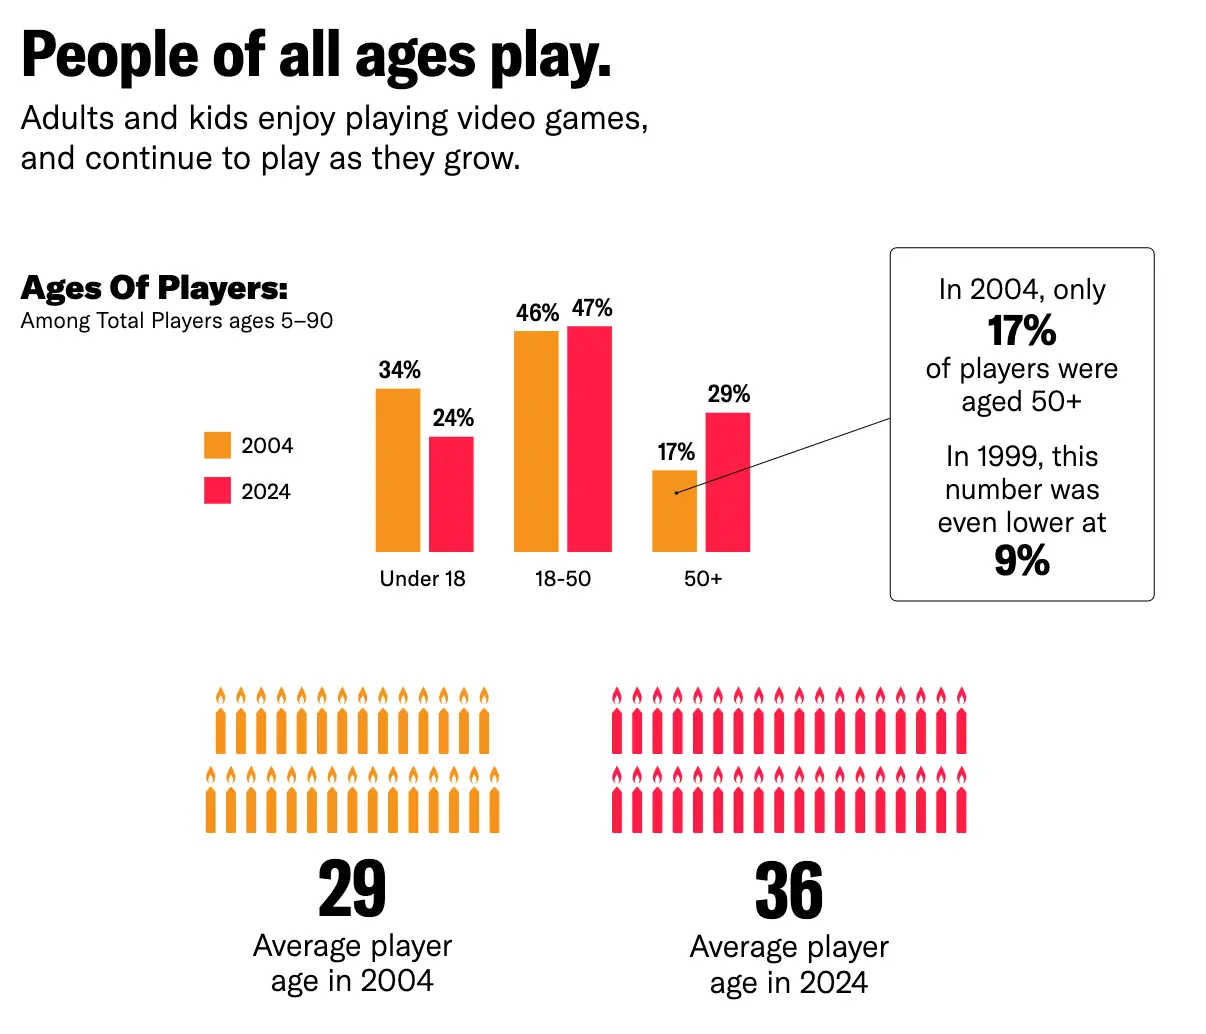
Looking to broader market data, shown below, we can see that the average age of gamers has increased from 29 in 2004 to 36 in 2024. The largest change is in the cohort under 18, which has fallen 10% over the past two decades — a trend that supports the conclusion that there are fewer child gamers than there used to be.
The Average Age of Gamers (2024):46
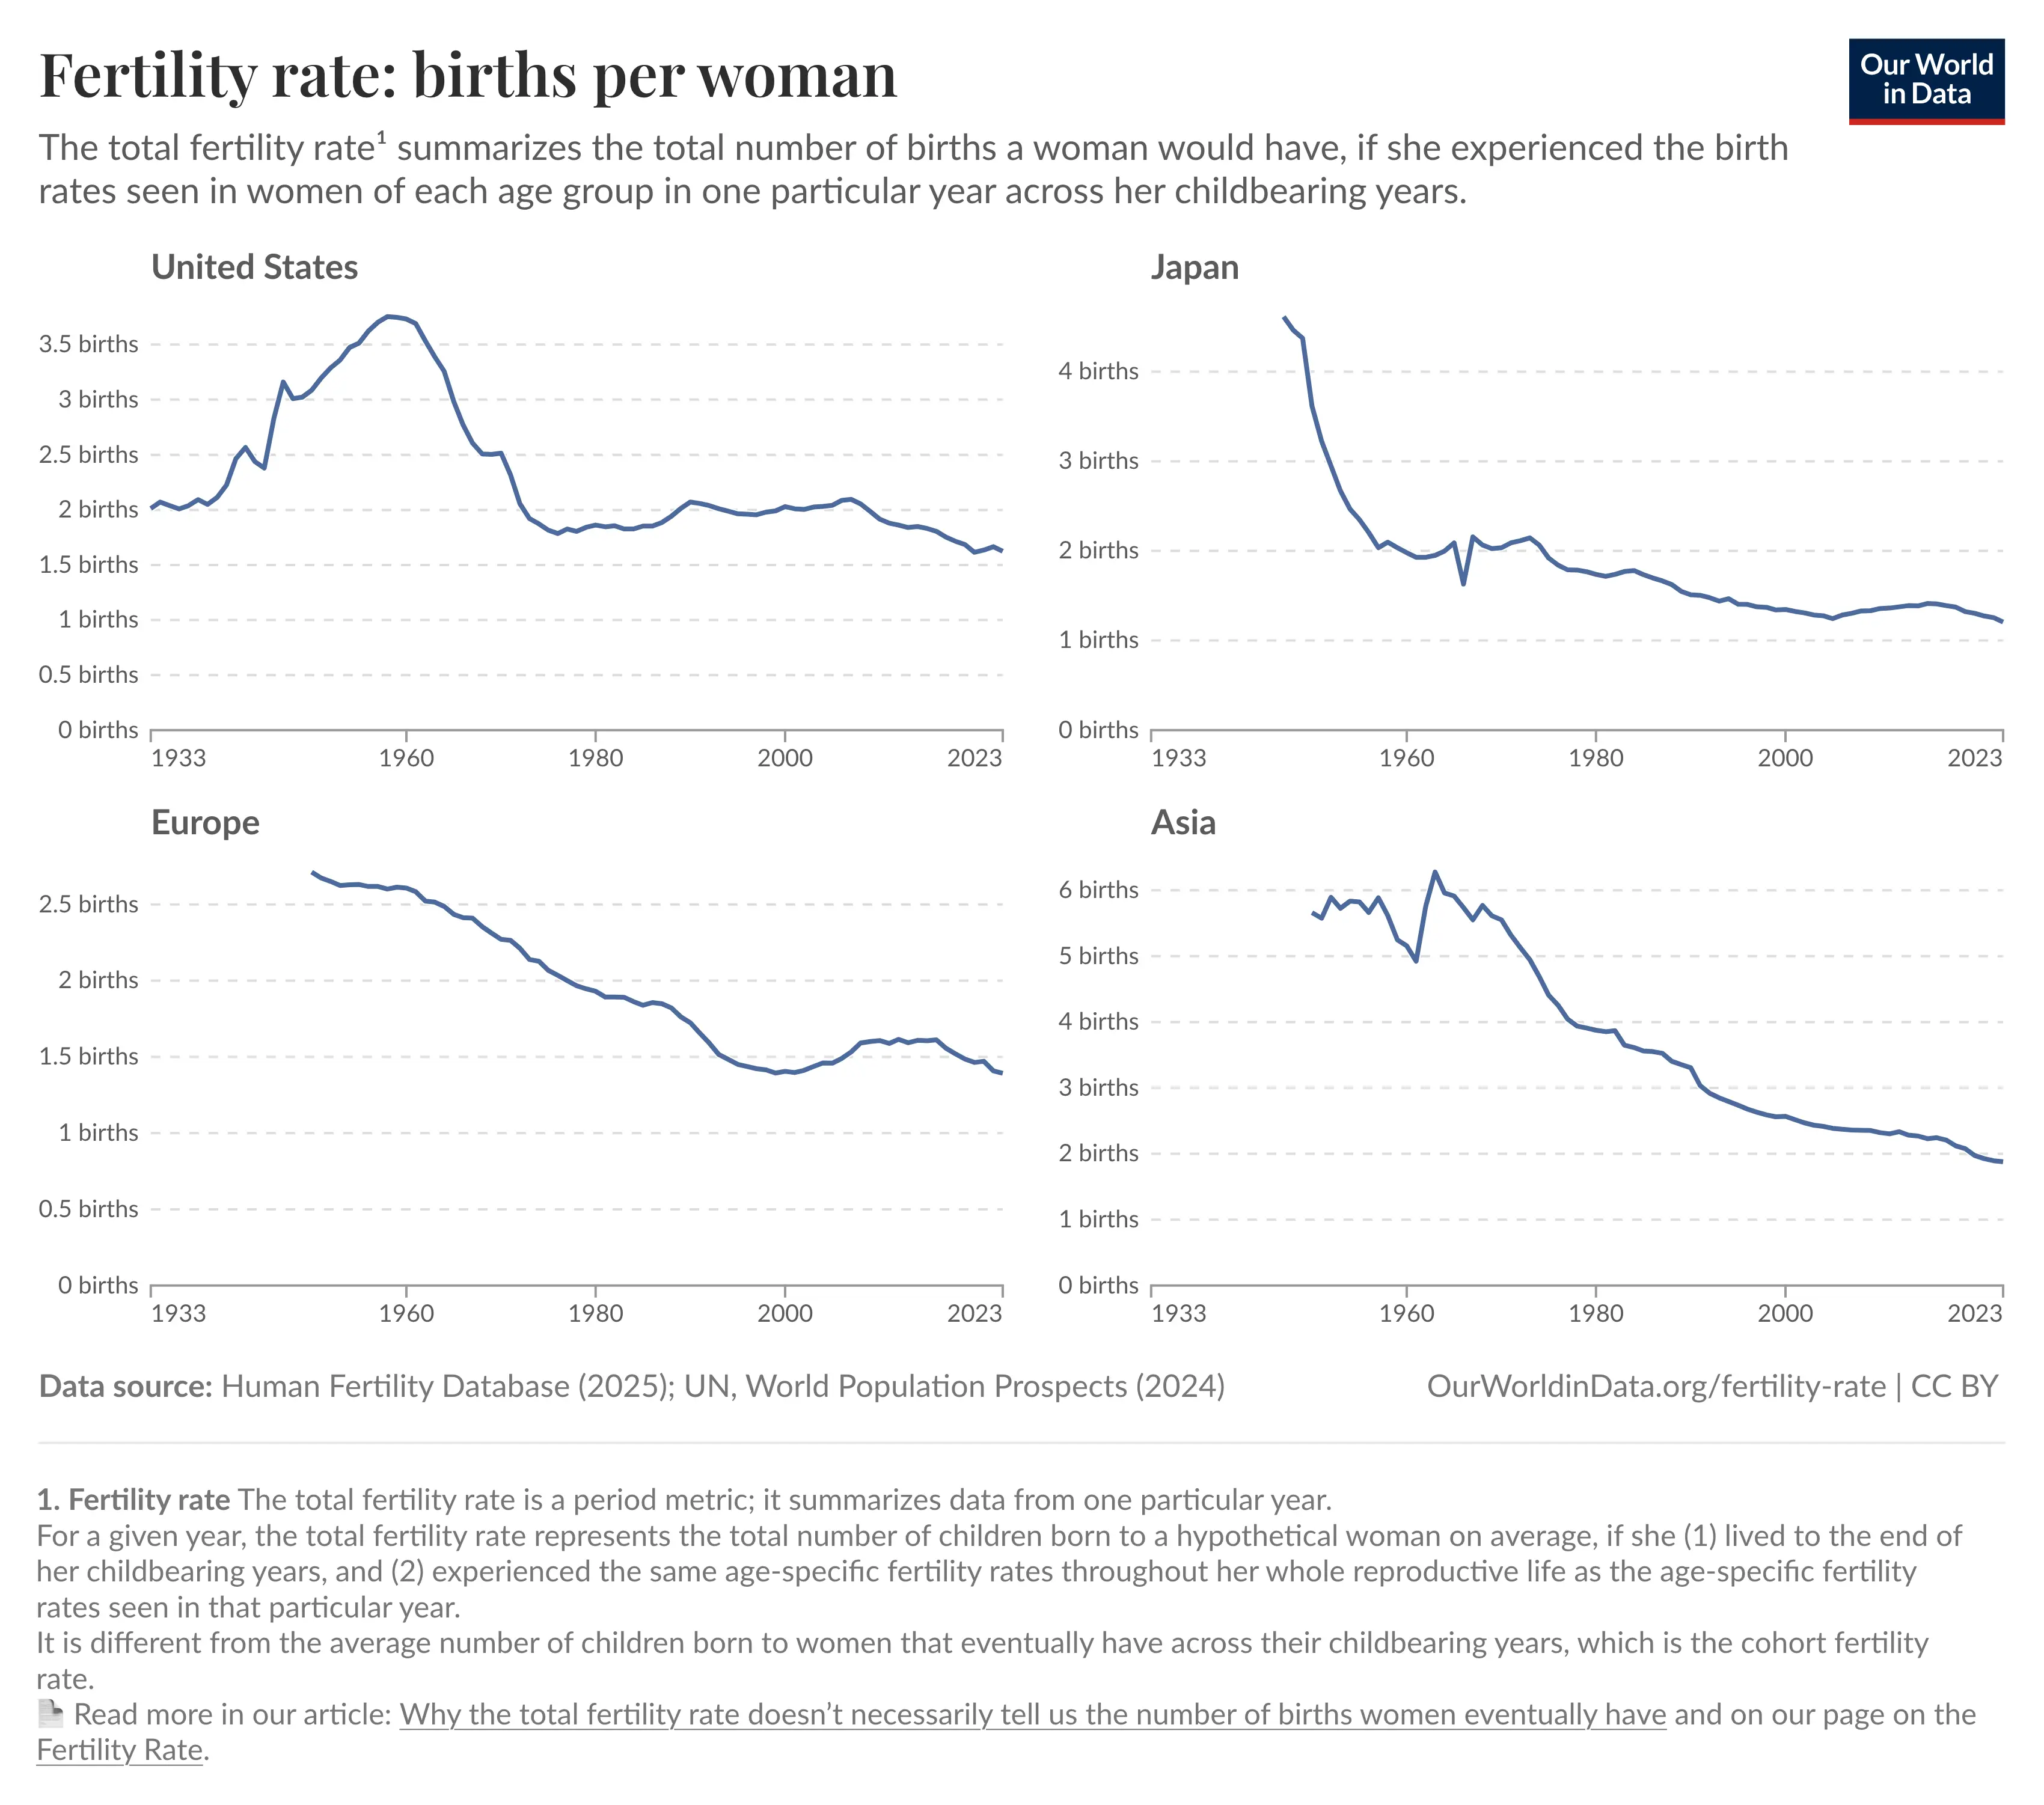
This appears to be caused by two compounding factors. First, there are simply fewer children. Demographics are destiny. This is, in my opinion, the most material trend for the majority of companies and industries across the global economy. It is particularly relevant for businesses that rely on children as their audience for long-term durability, like Nintendo.
Children Born Per Woman, 1933-Present:47
Second, according to the Pew Research Center, gaming is fundamentally less popular among American teens than it used to be. In 2008, 97% of teens aged 12–17 played computer, web, portable, or console games.48 In 2024, that figure was only 85%.49
This data, however, while illustrative of general industry trends, says little about Nintendo’s popularity among the children who are still gaming. For that, a decent indicator may be the Nickelodeon Kids’ Choice Award for Favorite Video Game. It is a children-voted popularity poll that has been running for over 30 years.
Kids Choice Awards - Nintendo Winners vs. Wins (1995-2025):50
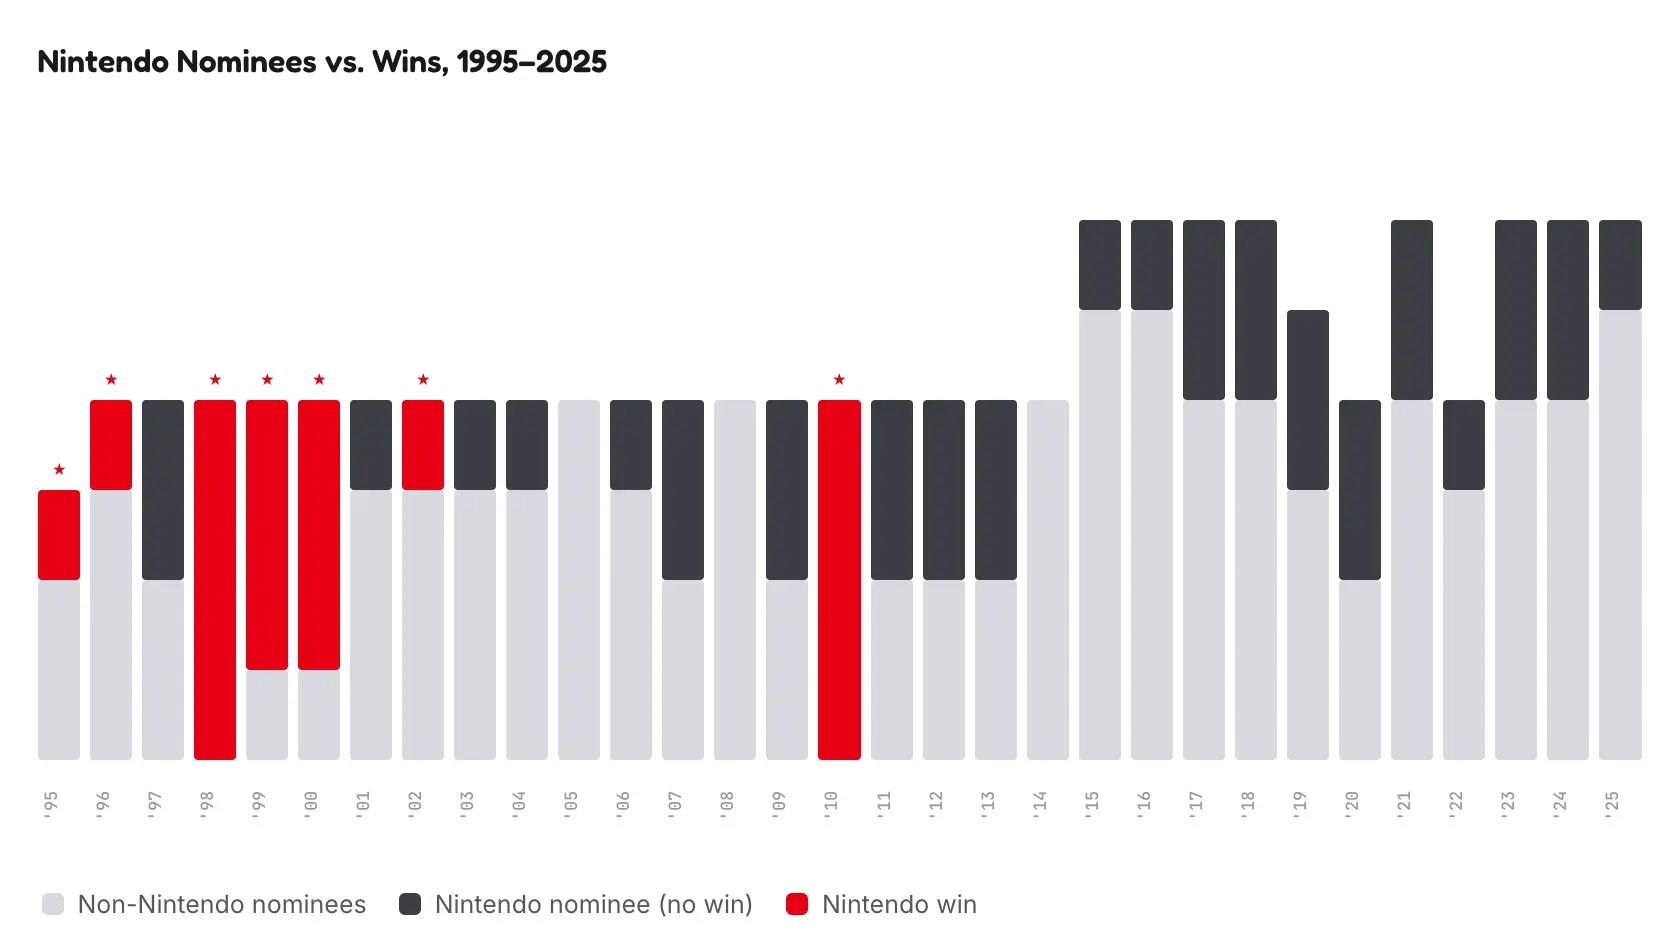
Each column in the chart above represents a ceremony. The full height is the total group of nominees, and the red or black portion represents the share of that group made up of Nintendo games. Red marks a year Nintendo won.
Immediately, two things stand out. First, Nintendo has been, and continues to be, an incredibly consistent presence in child gaming culture. At the same time, it hasn’t won the award in 15 years.
Kids Choice Awards - Nintendo Win Rate By Era (1995-2025):50
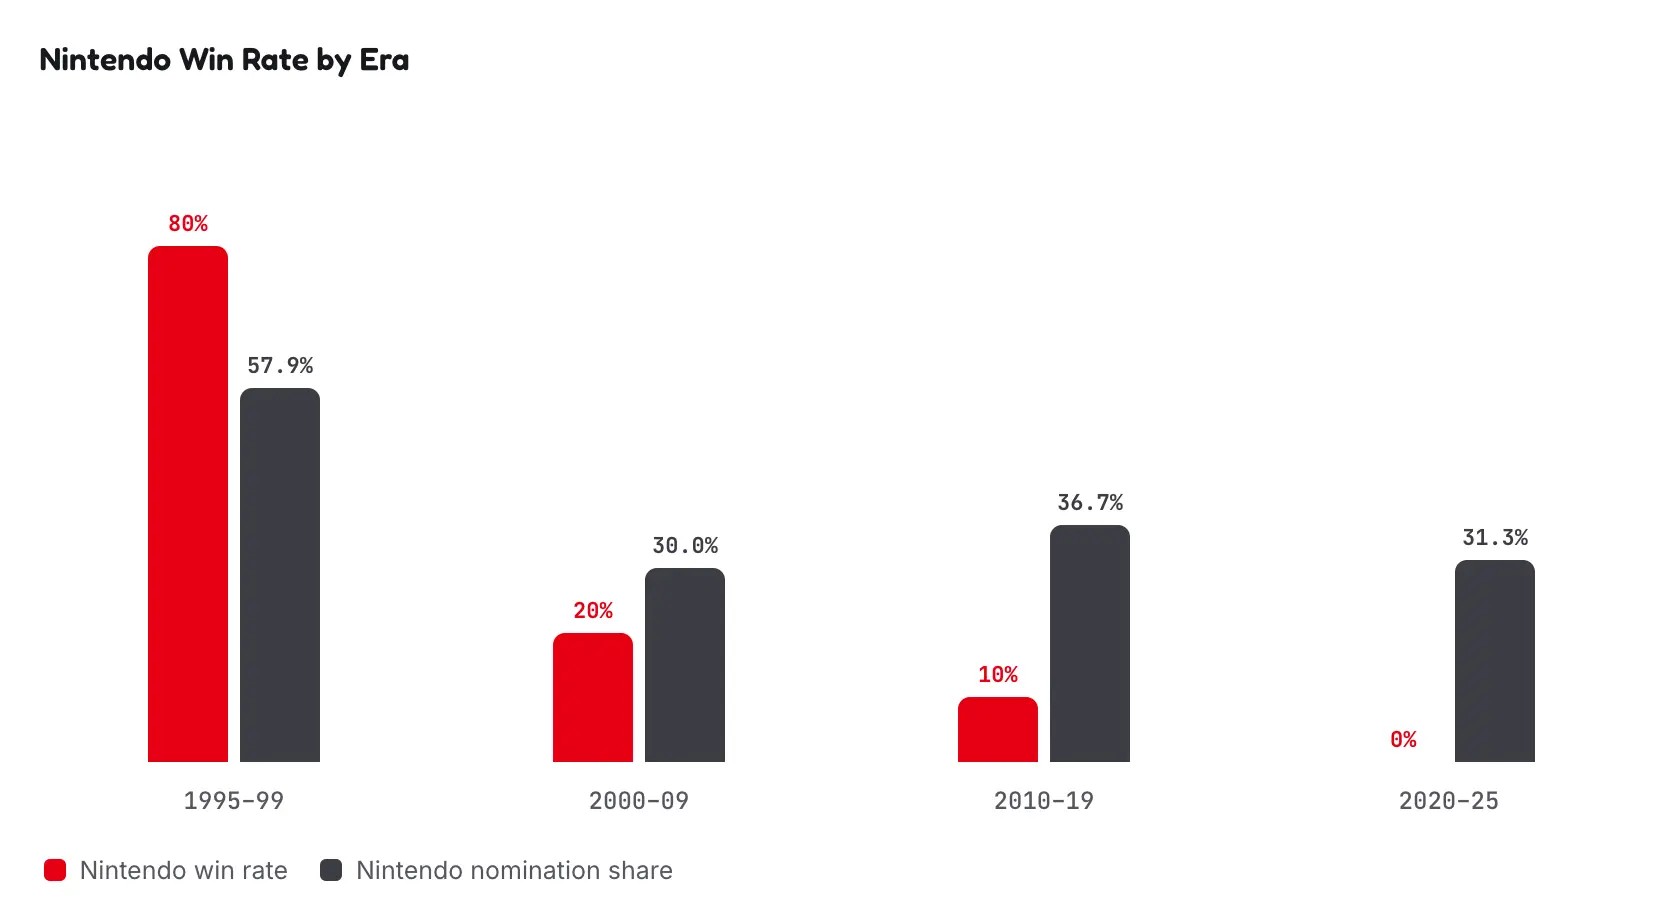
Charting the same data decade by decade, we see a similar pattern. Nintendo’s presence has remained flat since the 2000s, but its ability to win — to create the game kids love most — appears to have slowly eroded. There are likely two reasons for this. First, this analysis is admittedly flawed: it compares Nintendo, an entire business, to single games. So while votes for Minecraft or Just Dance cluster around a single title, Nintendo often has multiple candidates splitting the vote. That’s fine for assessing the cultural relevance of Nintendo IP, but not ideal for assessing its ability to win. Second, the chart below shows how the internet has changed gaming and children’s preferences.
Kids Choice Awards - Winner by Genre (1995-2025):50
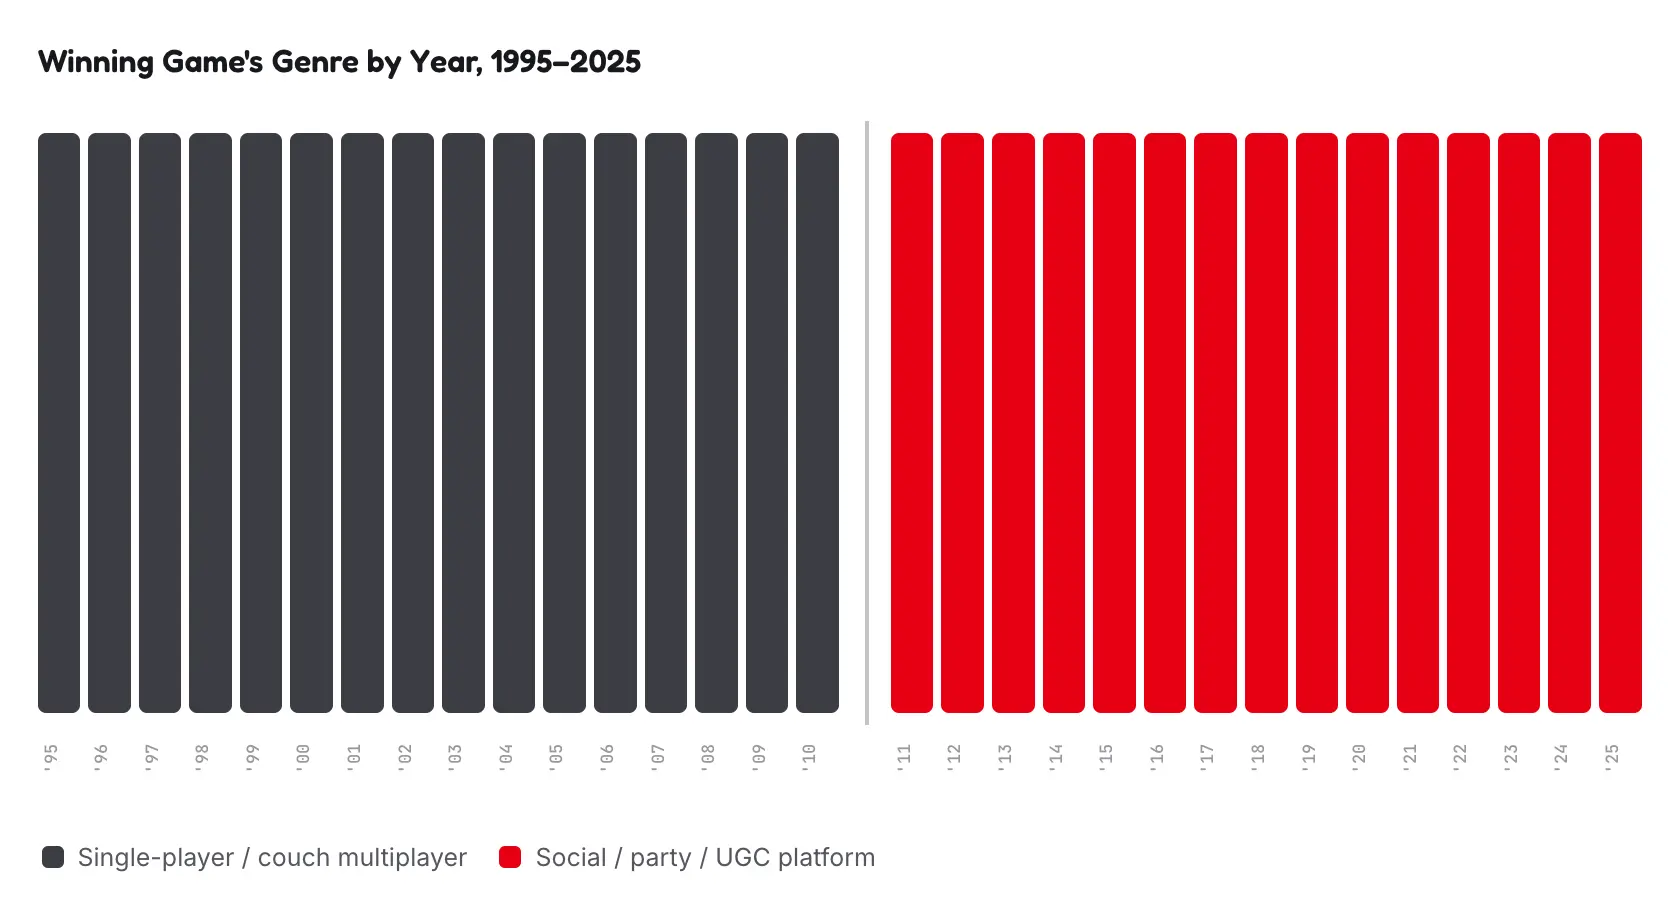
By categorizing each year’s winner as local (single-player or couch co-op) versus online or platform gaming (Roblox and Minecraft), we can clearly see that preferences shifted in 2010 and never went back.
My overall assessment is that while Nintendo games may not have the cultural dominance they had in the ’90s, the company has demonstrated a persistent relevance that has stayed relatively flat since the 2000s, despite major shifts in market preferences. I see this as a sign of strength rather than weakness. There is currently little indication that child gamers today are any less enthusiastic about Nintendo IP than they were 20 years ago. I don’t know where preferences will go next, but I’m confident that as the world changes, genre popularity will change with it.
In Charlie Munger’s book Poor Charlie’s Almanack, he discusses the boon Disney received from the invention of the VHS tape. The company, which had existed since 1923, sat on a large catalogue of movies and assets with no way to scale their distribution. The invention of the VHS tape, and later technological shifts like the internet, provided a massive scaling opportunity for the business without any real additional work on its part. He also discusses a similar boon Coca-Cola received from mass-market refrigeration, which allowed the product to be more readily available across the country in its ideal state for consumption.
The point here is that I see similar qualities in Nintendo. Nintendo did not invent GPS technology or augmented-reality technology, yet Pokémon GO — an adaptation of the franchise first released in 1996 — became one of the most popular and profitable games of 2016.51 It has remained popular since, and in 2021 was featured on the Nickelodeon nominee list. As long as the IP retains its ability to captivate audiences, it is likely to keep performing well in the future. The bigger question, for the next several decades, is the demographic trend of an aging or shrinking population in Nintendo’s key markets. This is unlikely to be a problem within the next ten years — the generations Nintendo succeeded in capturing are now entering their peak earning years — but for an investor taking an extremely long-term view, it’s worth monitoring.
Self-Inflicted Dilution
While opportunities are discussed below, it should be evident at this point in the research that the growth story for Nintendo stems from monetizing the IP. Yet, part of the moat discussed above was that Nintendo has full ownership of that IP, and thus the ability to ration exposure of it to its audience. Expanding IP touch points with more films, more parks, and more licensing deals appears to be in tension with the disciplined steady curation strategy that has worked so well for Nintendo. I have to wonder how many Mario movies can Nintendo make before their audience fatigues? Below, we will look into three different cases where IP expansion either broke the business, or compounded, and see what takeaways we can ascertain in understanding Nintendo’s risk as it expands into the business of broader IP monetization.
Disney Princesses
In 2000, Disney consolidated its princess characters into a single retail line, the Disney Princess franchise, and turned it into one of the largest licensing businesses in entertainment.52 The business model is simple: a film seeds the IP with a story and a cast, then the merchandising engine takes over, selling toys, theme park attractions, apparel, and endless side content. But, that monetization engine depends entirely on the quality of the canonical film to generate the emotional attachment that makes a child want the toy in the first place.
This shows up quite clearly in the data. Charting Rotten Tomatoes critic scores for every Disney Princess film going back to Snow White, a clear pattern emerges.
Disney Princesses Rotten Tomatoes Critic Score:53
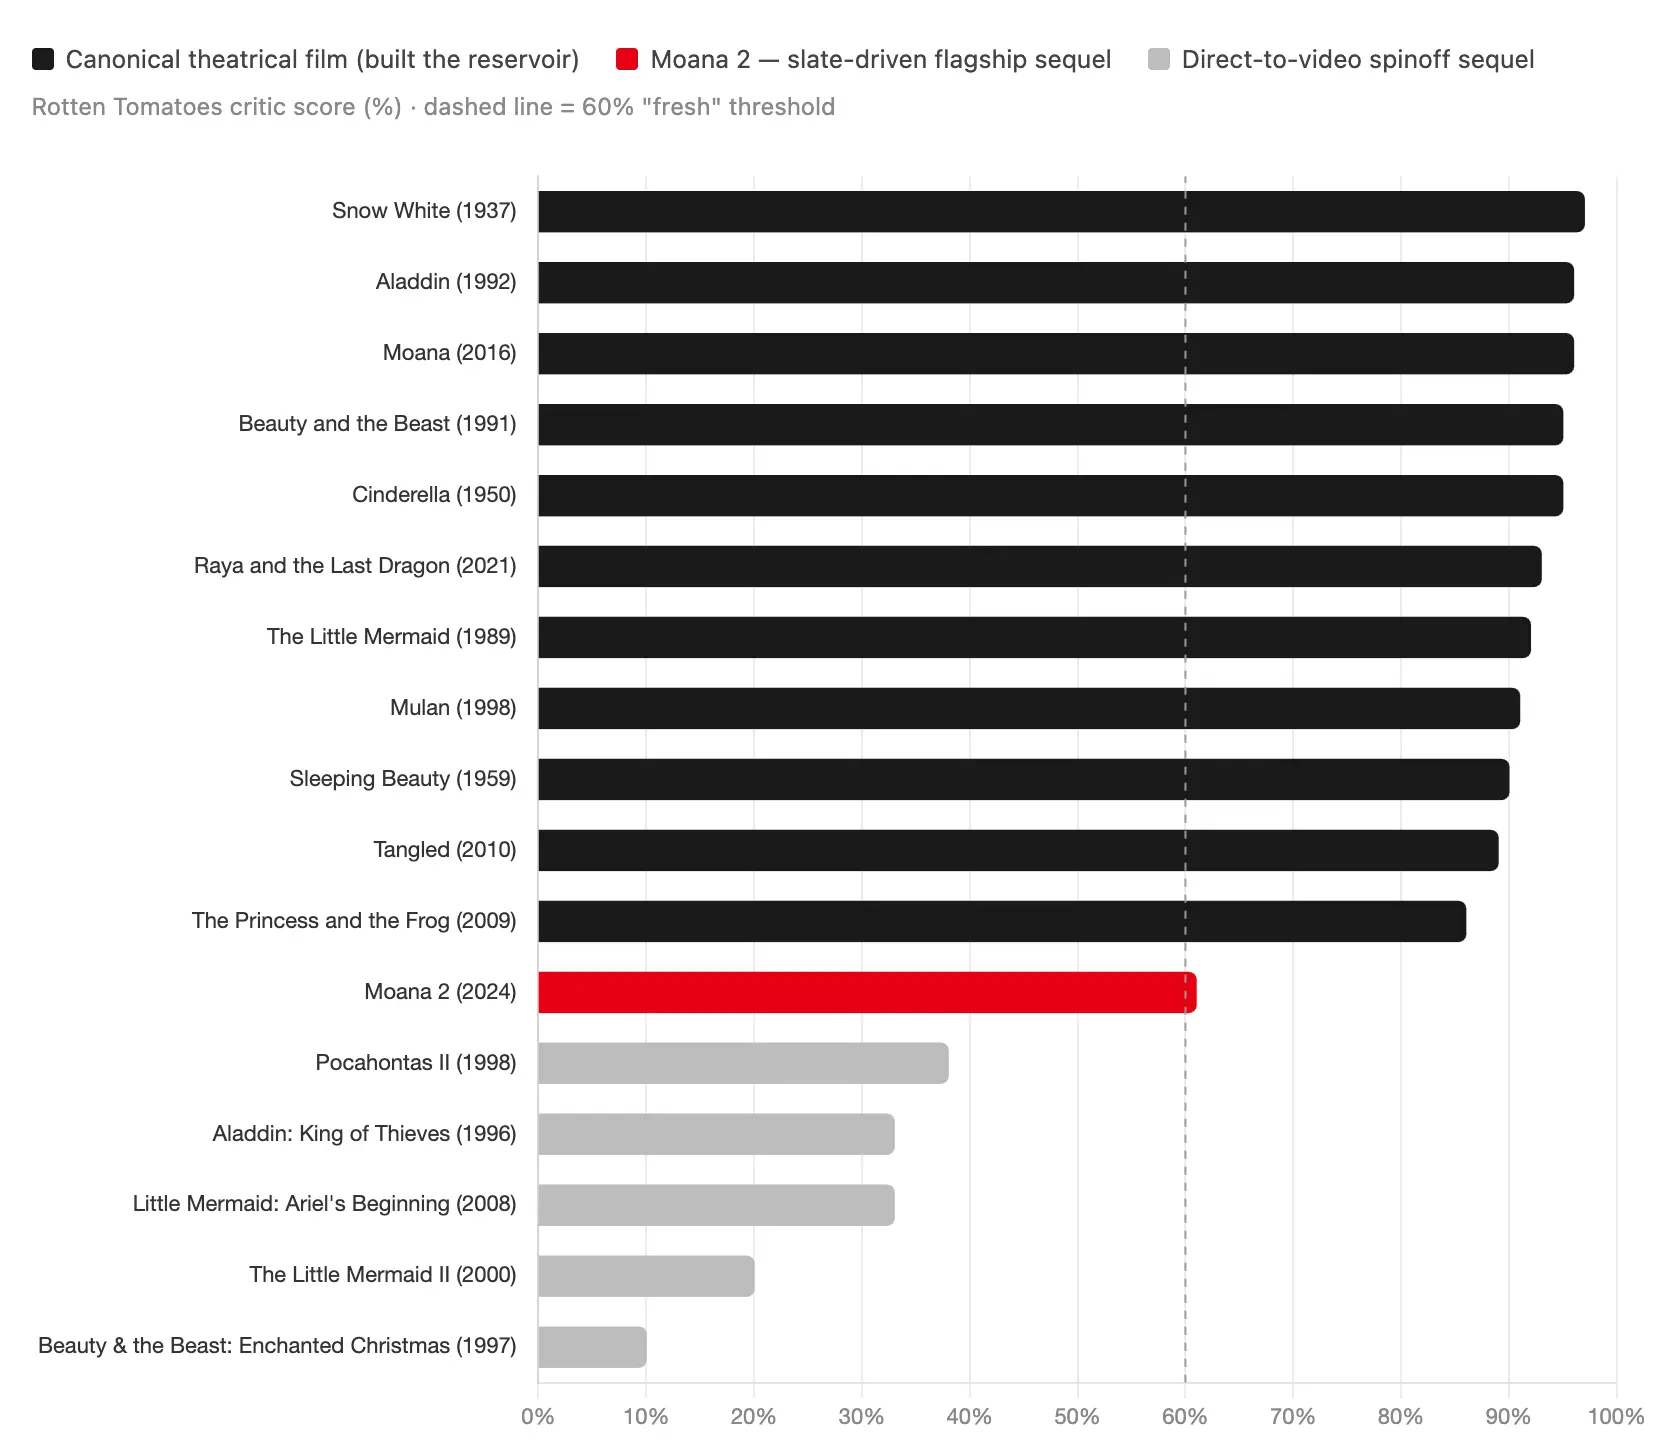
Films in black are canonical, Walt Disney Animation Studios originals, spanning eight decades. Almost all of them sit above an 80% critic score, with Moana 2 as the lone exception. Films in grey are non-canonical, direct-to-video, B-tier studio productions. Their scores are far lower.
What matters isn’t that the grey films were bad. It’s why they were allowed to be bad. None of them received a theatrical release or involved the original directors or creative leads. They were, in every meaningful sense, walled off from the core franchise, produced by a separate B-team to feed a content calendar without ever touching the asset that actually generates consumer affection.
That separation is the point. Disney could let a cheap, disposable Cinderella sequel absorb the pressure to constantly ship new content, while the canonical films stayed rare and protected. The merchandise machine got its volume. The brand equity stayed intact.
Lesson learned: the business of merchandise cannot be allowed to dictate the cadence or quality of the creative team producing the canonical asset. The moment monetization pressure bleeds into the thing that creates the affection in the first place, the whole flywheel breaks. Building a buffer between the two, and obsessively protecting the quality of the canonical stories (until recently, it seems) allows the merchandising business to run far and wide.
Angry Birds
Angry Birds is the failure case. At it’s peak in 2012, the franchise generated roughly $200M a year with 260 million monthly active players. Rovio, the developer, quickly expanded into lunchboxes, clothing, board games, Band-Aids, and more. By 2014, revenue had fallen 73% to about $10M. This collapse was directly attributable to declining brand-licensing revenue. The business was sold to Sega in 2023, for roughly $775M, a fraction of its peak worth.
Lesson learned: Rovio didn’t do anything Disney hasn’t done with its princess franchise. It expanded into exactly the same categories. The difference was the depth of the IP-universe. Angry birds was a simple, puzzle-like mobile game with no real characters or story. The relationship with the player was light fun, rather than deep connection. In reference to the Disney example above, we can expand the understanding of the IP business further than “quality drives IP”. It’s that IP generates affection reservoirs that the expansion into merchandise draws on. Depth in the reservoir comes from great stories, and years of quality interaction with the characters. Without that, the reservoir draws down quicker than it can be replaced.
Pokémon
Pokémon, the next case study, is the most valuable comparison we can make because it is 32% owned by Nintendo and is one of the most aggressively exploited IPs in the world: games, trading cards, a decades-running anime, films, Pokémon GO, and an ungodly amount of merchandise. As a private company, financial information is sparse; however, estimates put lifetime revenue between $115B and $150B USD.54 55 The most important thing to understand is that of this total, an estimated one-fifth comes from the games themselves. The rest is merchandise, cards, etc.56 We can speculate that the economics work like this:
- The mainline games, while being the smallest revenue slice, function to generate new creatures, characters, and lore. The core game loop of capturing, training, and battling creatures has remained the same for thirty years and effectively bootstraps new players into the attachment they form with their favourite Pokémon, while compounding the same attachment older players already have. It is fuel for the business.
- The anime, movies, and spin-off games like Pokémon GO function as top-of-funnel reach extension, pulling in children and more casual mobile players.
- The Trading Card Game (TCG) and licensed merchandise is the evergreen profit centre. The TCG literally prints high-margin, pieces of paper that the global fan base has turned into a genuine asset class. While the licensed merchandise, like stuffed animals, provide other high margin products. This business line digitalized in late 2024 with the cross-platform app “Pokémon Trading Card Game Pocket.” Officially released financial information from the Japanese government shows 2025 year-over-year revenue growth for The Pokemon Company of nearly 40%.57 Given little other activity from Pokémon this year (no new games or major releases), most of this growth must be coming from the digital trading card game.
This framework illustrates the affection reservoir thesis again. Games may be in fact the best way to build audience affection as in essence, the player actually lives the story themself rather than just watches it. Decades of Pokemon games with the same core loop, but different characters and creatures has created an incredibly deep reservoir of affection and content to monetize through the Trading Card Game and other surfaces.
What is interesting, though, is that despite growing revenues, the chart below clearly shows a degradation of quality in the games since 2016. With revenues trending up, but core franchise quality trending down, it paints a picture of the franchise being monetized harder than ever with the creative core getting weaker.
Pokemon Game Scores:58
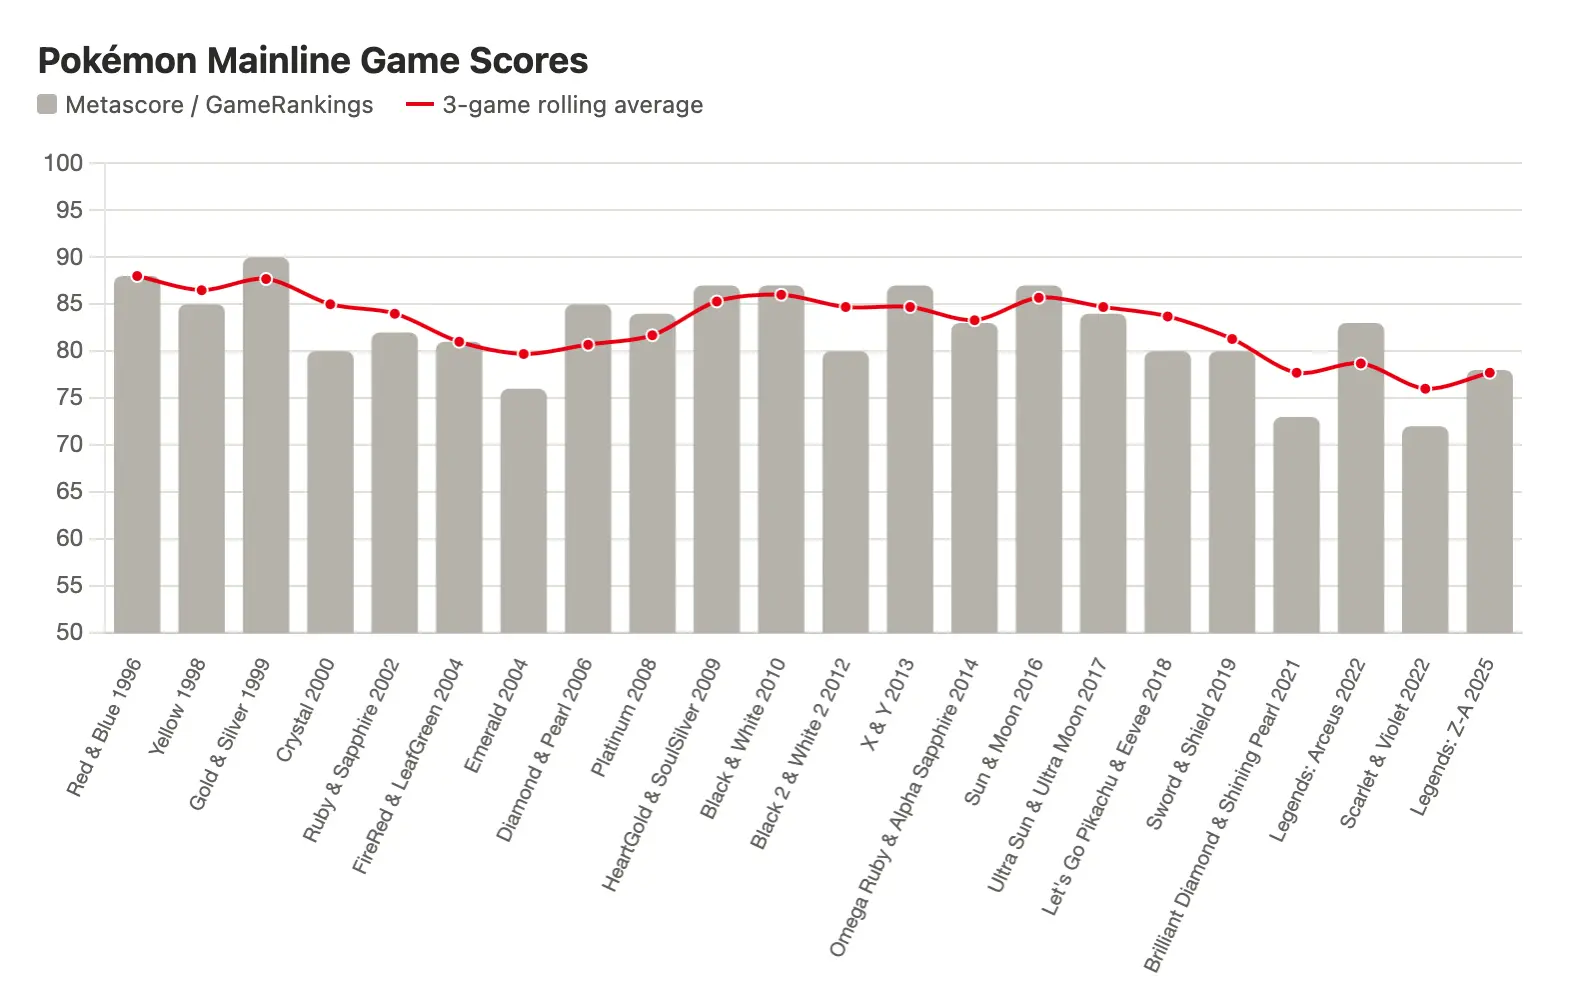
In my eyes, this is further confirmed simply by viewing the Pokemon that are most heavily pushed through the merchandise. Across a range of new and old Pokemon cards, and using price as a proxy for broad secondary market demand, it is clear that the most popular Pokemon are the old ones. I can tell, because I recognize all of them from when I was a young Pokemon trainer. Scrolling through the list, it seems all the most popular pokemon are older creatures, and this indicates that while the affection reservoir discussed above is incredibly deep, it is being drawn down faster than it is being refilled. If this was not the case, I would expect to see at least one newer pokemon on this popularity chart.
Most Expensive Pokemon Cards:59
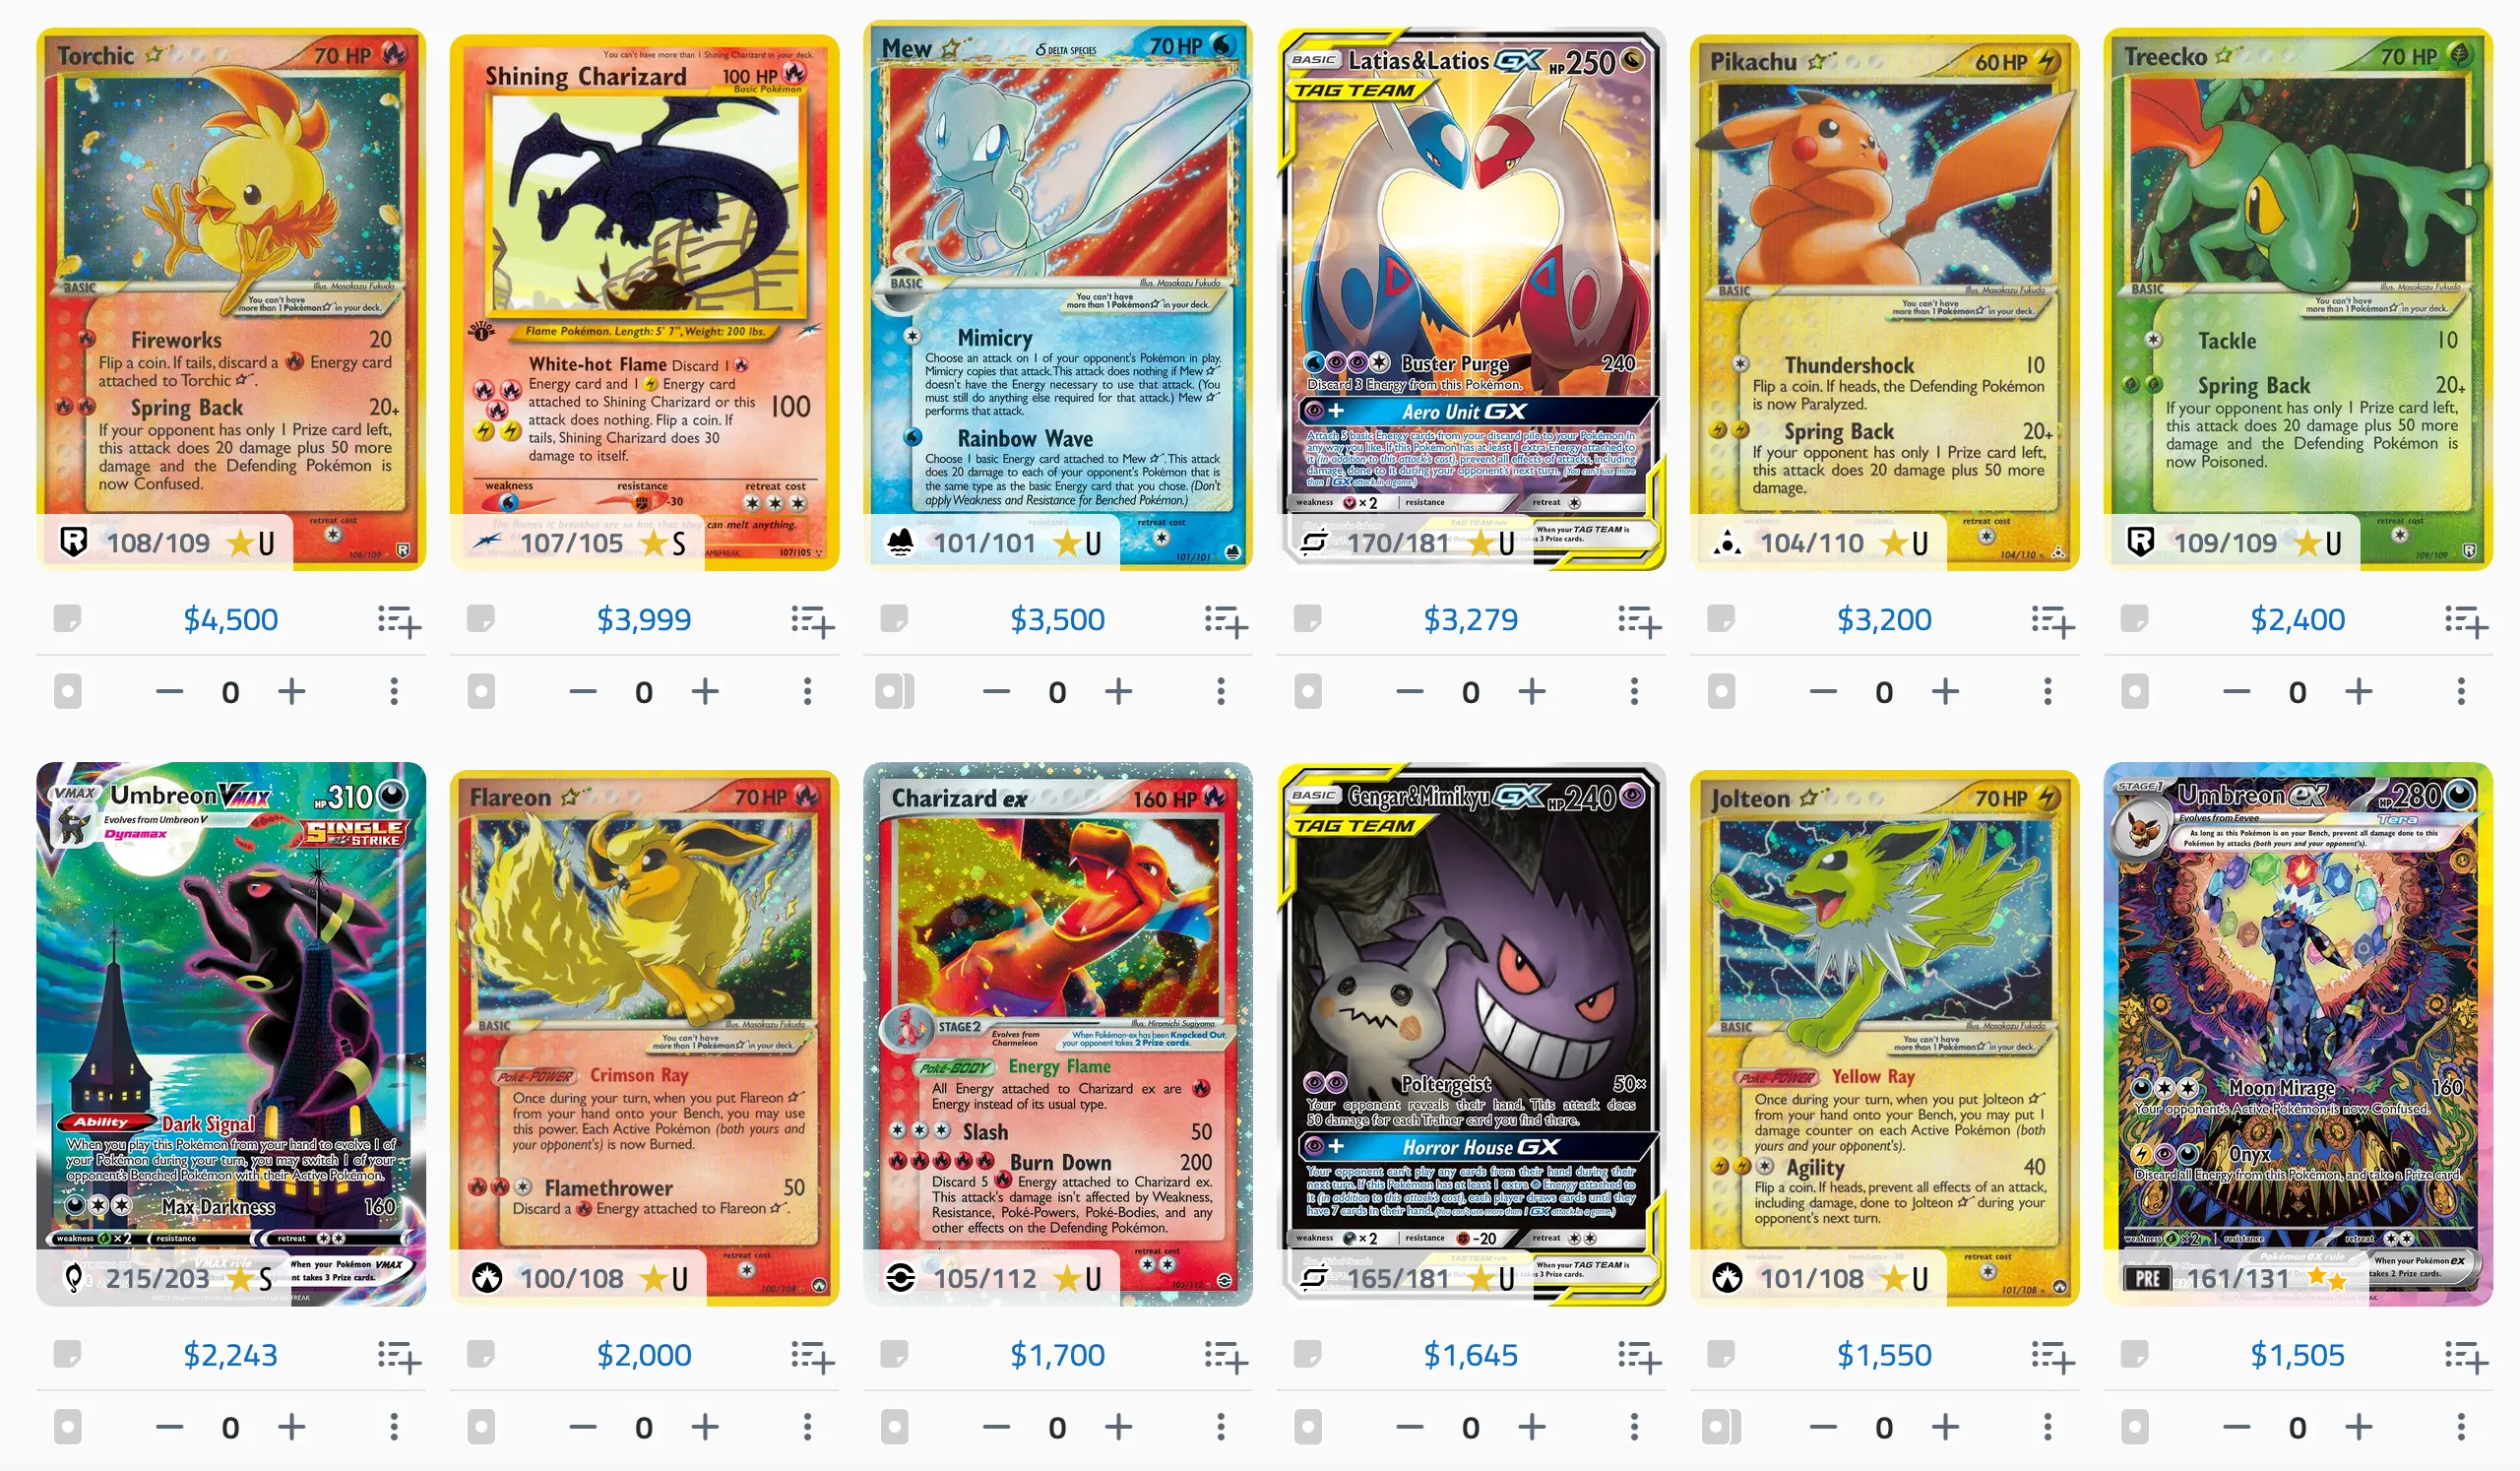
The danger for Nintendo, and the investor is that the financial results of Pokemon today, looks like success, while the moat - the affection reservoir - is depleted. The Pokemon Company’s stewardship has done a brilliant job of monetizing its reservoir and maintaining the commercial momentum, but it has not protected the core game’s quality the way that the reservoir thesis requires. Speculatively, each new poorly reviewed Pokemon game is another indicator that future results may not be as strong as history alone predicts.
Lesson learned: The reason this matters is that, of course, Pokemon exists within the Nintendo corporate family. But, it is unknown how much control Nintendo has over the quality and cadence of Pokemon games. For an investor who is betting on Pokemon as the playbook for Mario and Zelda, the discipline for Nintendo to focus on quality in the games - the driver of the affection reservoir - is imperative.
Nintendo
The reassuring point to make on Nintendo is that the wholly owned franchises show no quality erosion despite the recent expansions into film, parks, and merchandise. Metacritic scores have generally trended down over the last 20 years60, so against that trend it seems that Mario games have remained highly enjoyable and Legend of Zelda games may have actually become better. The takeaway here is that Nintendo itself seems to have the discipline and understanding of what is required to maintain an exploitable IP franchise, while its partner Pokemon may not. This matters for Nintendo. Pokemon and Nintendo are strongly associated in consumer minds. Pokemon has only ever been playable on Nintendo devices and Nintendo’s 32% stake in the company is a material part of its valuation. But it does not kill the thesis either. Purely speculating, if the Pokemon franchise ever appeared to actually be impaired in its ability to sell merchandise, it may be possible for Nintendo to have preferential access to acquire a controlling stake in the business and/or provide more resources to Game Freak in developing the series. The secondary takeaway from this section of the analysis is that we gain an important insight into predicting the performance of the business going forward. With the reservoir mental model in mind, it becomes clear that the sales figures for a game are not the most relevant metric for future success. It is possible to break sales records while drawing down the affection reservoir, without refilling it. The important thing to track is the quality of the games released by Nintendo. As long as the quality remains high, the reservoir gets refilled, and the broad monetization of the IP remains intact.
Super Mario Mainline Game Scores (Metacritic):
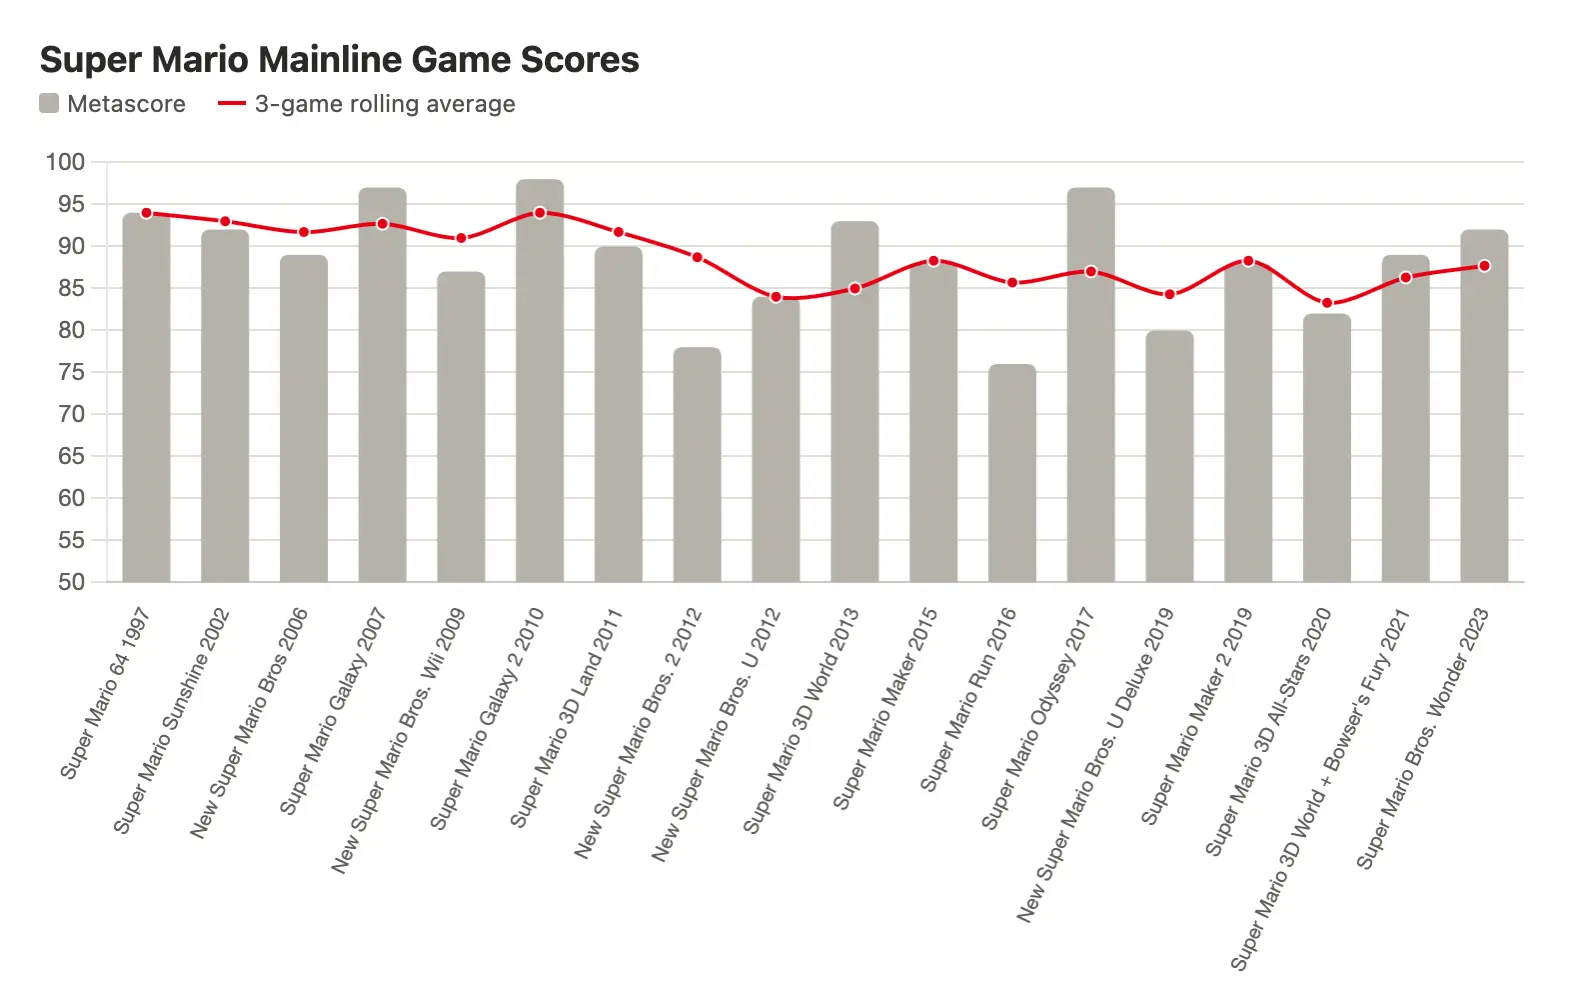
Legend Of Zelda Mainline Game Scores (Metacritic):
Opportunities
Management
Valuation
1. The Comparison
Nintendo bought Activision-Blizzard for $70B, a worse business. Nintendo’s enterprise value is ~$50B.
2. Logic
Reverse DCF, segment growth
3. Discounted Cash Flow
Full DCF.
Footnotes
-
Fiscal Year Ended March 2026 Earnings Release/ Financial Results Briefing (Online), https://www.nintendo.co.jp/ir/pdf/2026/260508e.pdf ↩
-
Back-calculated. See valuation section. ↩
-
Fiscal Year Ended March 2026 Earnings Release/ Financial Results Briefing (Online), https://www.nintendo.co.jp/ir/en/events/index.html ↩
-
Six Months Financial Results Briefing/ Corporate Management Policy Briefing (Online) , https://www.nintendo.co.jp/ir/pdf/2022/221109e.pdf ↩ ↩2
-
www.theguardian.com/technology/2025/apr/14/risks-children-roblox-deeply-disturbing-researchers ↩
-
https://newzoo.com/resources/trend-reports/newzoo-global-games-market-report-2025 ↩
-
Fiscal Year Ended March 2026 Earnings Release/ Financial Results Briefing (Online), https://www.nintendo.co.jp/ir/pdf/2026/260508e.pdf ↩
-
Fiscal Year Ended March 2026 Earnings Release/ Financial Results Briefing (Online), https://www.nintendo.co.jp/ir/pdf/2026/260508_5e.pdf ↩
-
https://techcrunch.com/2021/03/30/console-game-china-pulled-ecommerce/ ↩
-
https://www.sony.com/en/SonyInfo/IR/library/presen/er/pdf/25q4_supplement.pdf ↩
-
Fiscal Year Ended March 2026 Earnings Release/ Financial Results Briefing (Online), https://www.nintendo.co.jp/ir/pdf/2026/260508_5e.pdf ↩
-
https://www.sony.com/en/SonyInfo/IR/library/presen/business_segment_meeting/pdf/2025/GNS_E.pdf ↩
-
https://corpgov.law.harvard.edu/2025/10/21/tokyo-stock-exchange-initiative-on-cost-of-capital-and-stock-price-conscious-management/ ↩
-
https://finance.yahoo.com/technology/articles/12-billion-electronics-retailer-says-144813046.html ↩
-
https://blogs.microsoft.com/on-the-issues/2024/10/15/one-year-activision-blizzard/ ↩
-
https://en.wikipedia.org/wiki/List_of_video_games_featuring_Mario ↩
-
Link not provided for legal purposes, however, fan made games can be found extremely easily through google search. ↩
-
https://en.wikipedia.org/wiki/Intellectual_property_protection_by_Nintendo ↩
-
Data pulled manually from each companies’ financial reports. ↩
-
Data pulled manually from each companies’ financial reports. ↩
-
Data pulled manually from each companies’ financial reports. ↩
-
https://en.wikipedia.org/wiki/2022%E2%80%932026_video_game_industry_layoffs ↩
-
https://tech-insider.org/video-game-industry-layoffs-2026/ ↩
-
https://www.reddit.com/r/skyrim/comments/1in7e50/graphical_evolution_of_skyrim_vanilla_modded/ ↩
-
https://vaulted.games/blog/how-long-should-you-wait-to-buy-a-new-game-a-price-drop-timeline ↩
-
https://camelcamelcamel.com/product/B097B2YWFX?context=search ↩
-
https://camelcamelcamel.com/product/B0F66DXJNM?context=search ↩
-
https://www.playstation.com/en-ca/games/god-of-war-ragnarok/ ↩
-
https://www.cbc.ca/news/business/apple-price-hike-ipad-macbook-ai-memory-chip-2026-9.7248577 ↩
-
https://www.theesa.com/wp-content/uploads/2024/05/Essential-Facts-2024-FINAL.pdf ↩
-
https://www.pewresearch.org/internet/2008/09/16/teens-video-games-and-civics/ ↩
-
https://www.pewresearch.org/internet/2024/05/09/teens-and-video-games-today/ ↩
-
https://en.wikipedia.org/wiki/Kids’_Choice_Award_for_Favorite_Video_Game ↩ ↩2 ↩3
-
https://en.wikipedia.org/wiki/List_of_highest-grossing_media_franchises ↩
-
https://editorial.rottentomatoes.com/guide/disney-princess-movies/ ↩
-
https://en.wikipedia.org/wiki/List_of_highest-grossing_media_franchises ↩
-
https://en.wikipedia.org/wiki/Pok%C3%A9mon_(video_game_series) ↩
-
https://www.tcgcollector.com/cards/intl?releaseDateOrder=newToOld&displayAs=images&sortBy=marketPriceDesc ↩
-
https://n4g.com/news/2003793/20-years-of-metacritic-scores-shows-a-steady-decline-in-90-and-above-titles ↩