Booking Holdings Business Analysis · 2026
This is a deep dive into Booking Holdings’ business. The first two sections aim to build a strong foundational understanding of the business model, how Booking actually makes money, how it came to look the way it does today, and what the financial statements tell us about the quality of the business. The remaining sections take a closer look at the business from an investment perspective to cover the moat and competitive landscape, the risks, management quality, and valuation.
On Relevancy
Information in this report may be outdated. My investing style is long-term oriented and therefore my writing and research is focused on understanding the business and its durability across time, not next quarter. I also may or may not hold a stake in this company which directly sets my incentive to follow the business after this research was originally performed. Invest at your own risk.
AI Executive Summary
TBD
1. Business Overview
Core Overview
Booking Holdings (Booking) owns and operates several online travel agencies and other reservation and travel related entities. Its largest brand, Booking.com, headquartered in Amsterdam, lists roughly 4.4 million accommodations across over 220 countries and 40 languages. Booking also owns Priceline, Agoda, KAYAK, and OpenTable, along with several other brands. While brand segment revenue is not reported, Booking.com produces a disproportionate amount of Booking’s sales.
Booking Holdings’ Brands and Services1
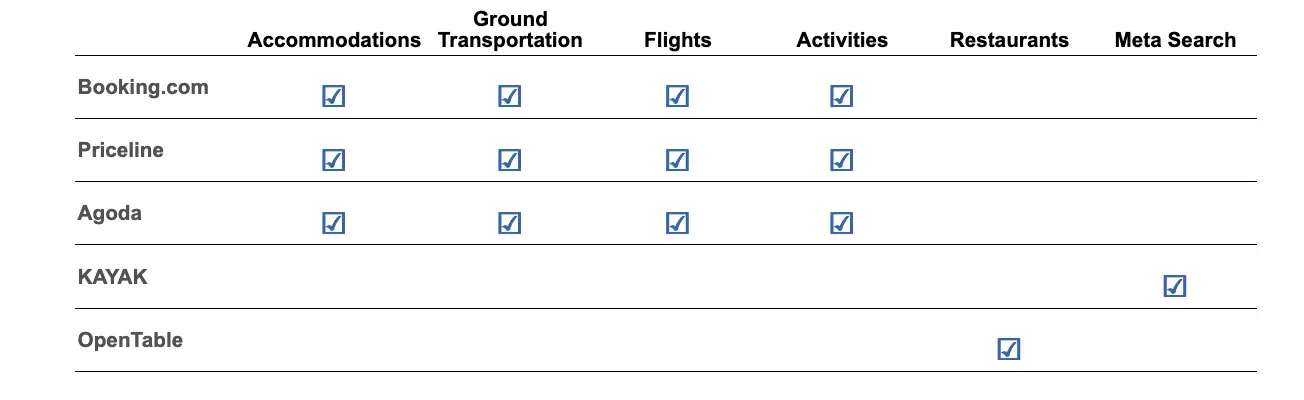
At its core, Booking is a two-sided marketplace. On one side are travellers looking for somewhere to stay, and on the other are the hotels and hosts with rooms to fill. Booking earns its money by connecting the two. Its value and durability comes back to how well it serves each side.
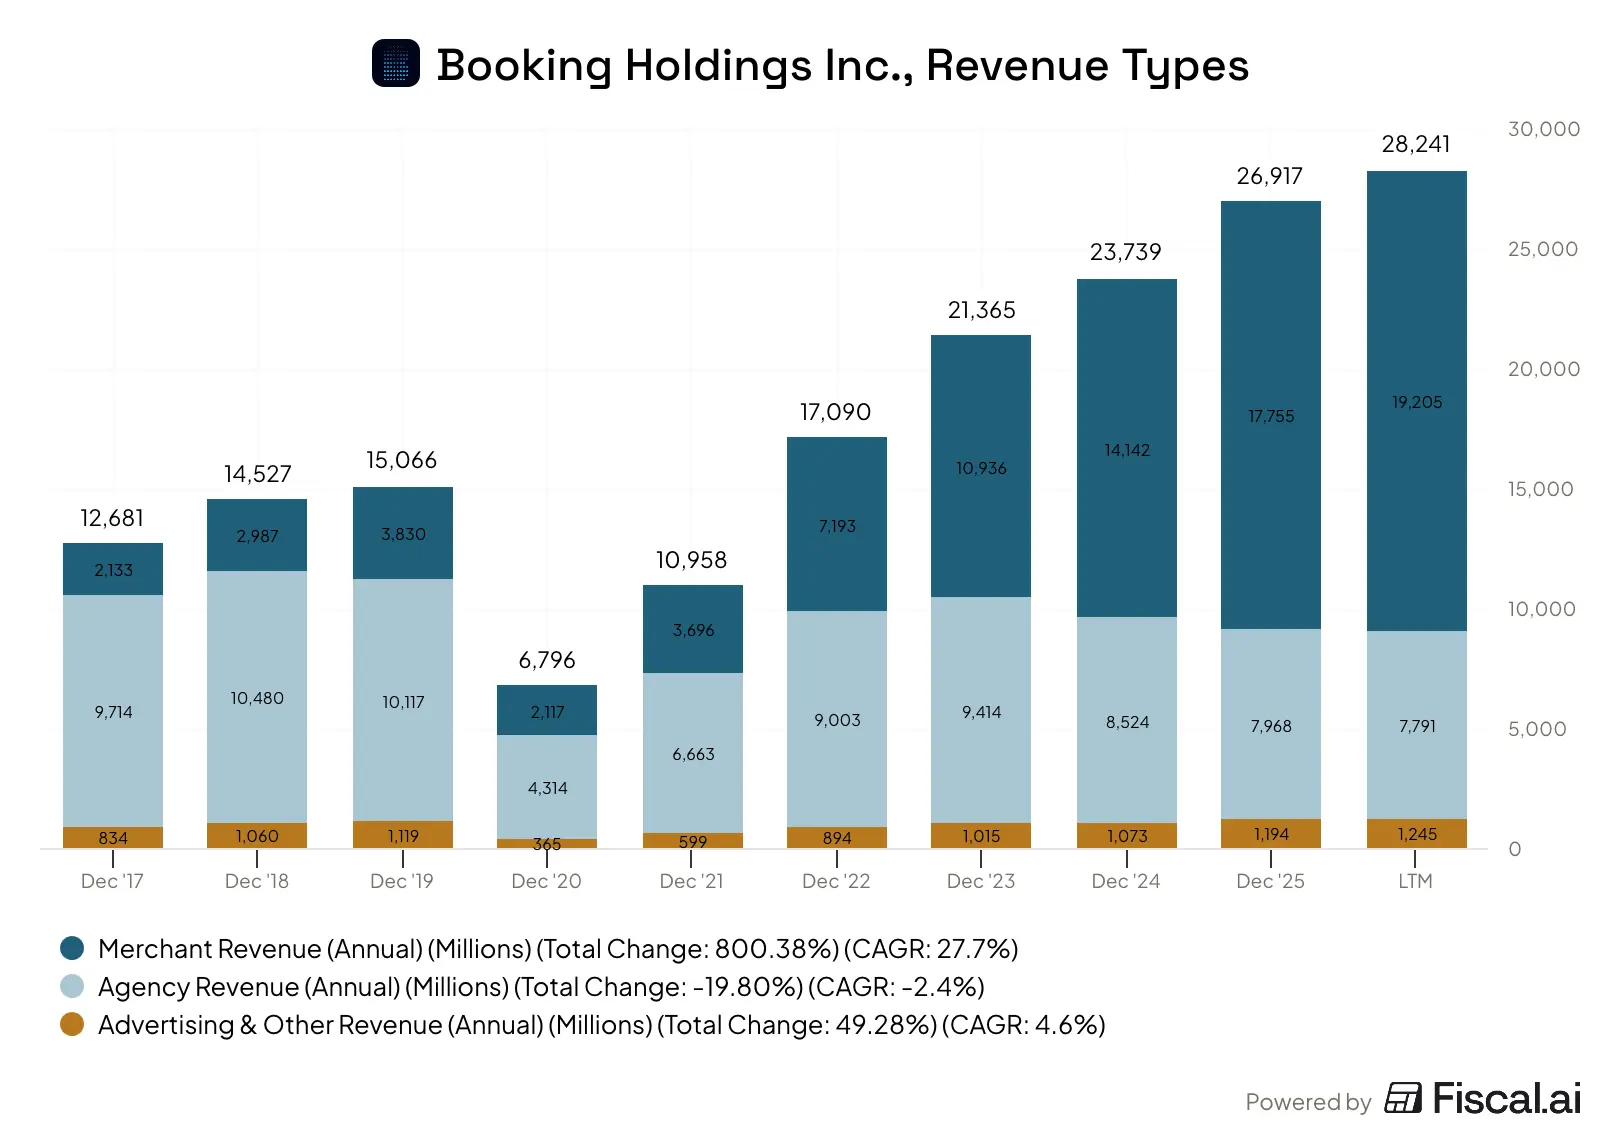
The company earns revenues in three ways: 2
- Agency Revenue - A direct commission paid by a hotel to Booking after the guest stays. The guest pays the hotel directly.
- Merchant Revenue - Booking takes the traveler’s payment at the time of reservation, holds it, and pays the hotel later. Booking keeps the margin, plus payment processing fees.
- Advertising and other revenue - These are mostly produced by KAYAK and OpenTable, from sending referrals to partners, advertising placements, restaurant reservation fees, and subscription fees for restaurant management services.
Booking Holdings Inc., Revenue Types
Understanding Merchant and Agency revenue requires knowing two separate terms:
- Gross Bookings - This is the total purchase value of the transactions, of which most is remitted to the hotel or alternative accommodation partner at check-in.
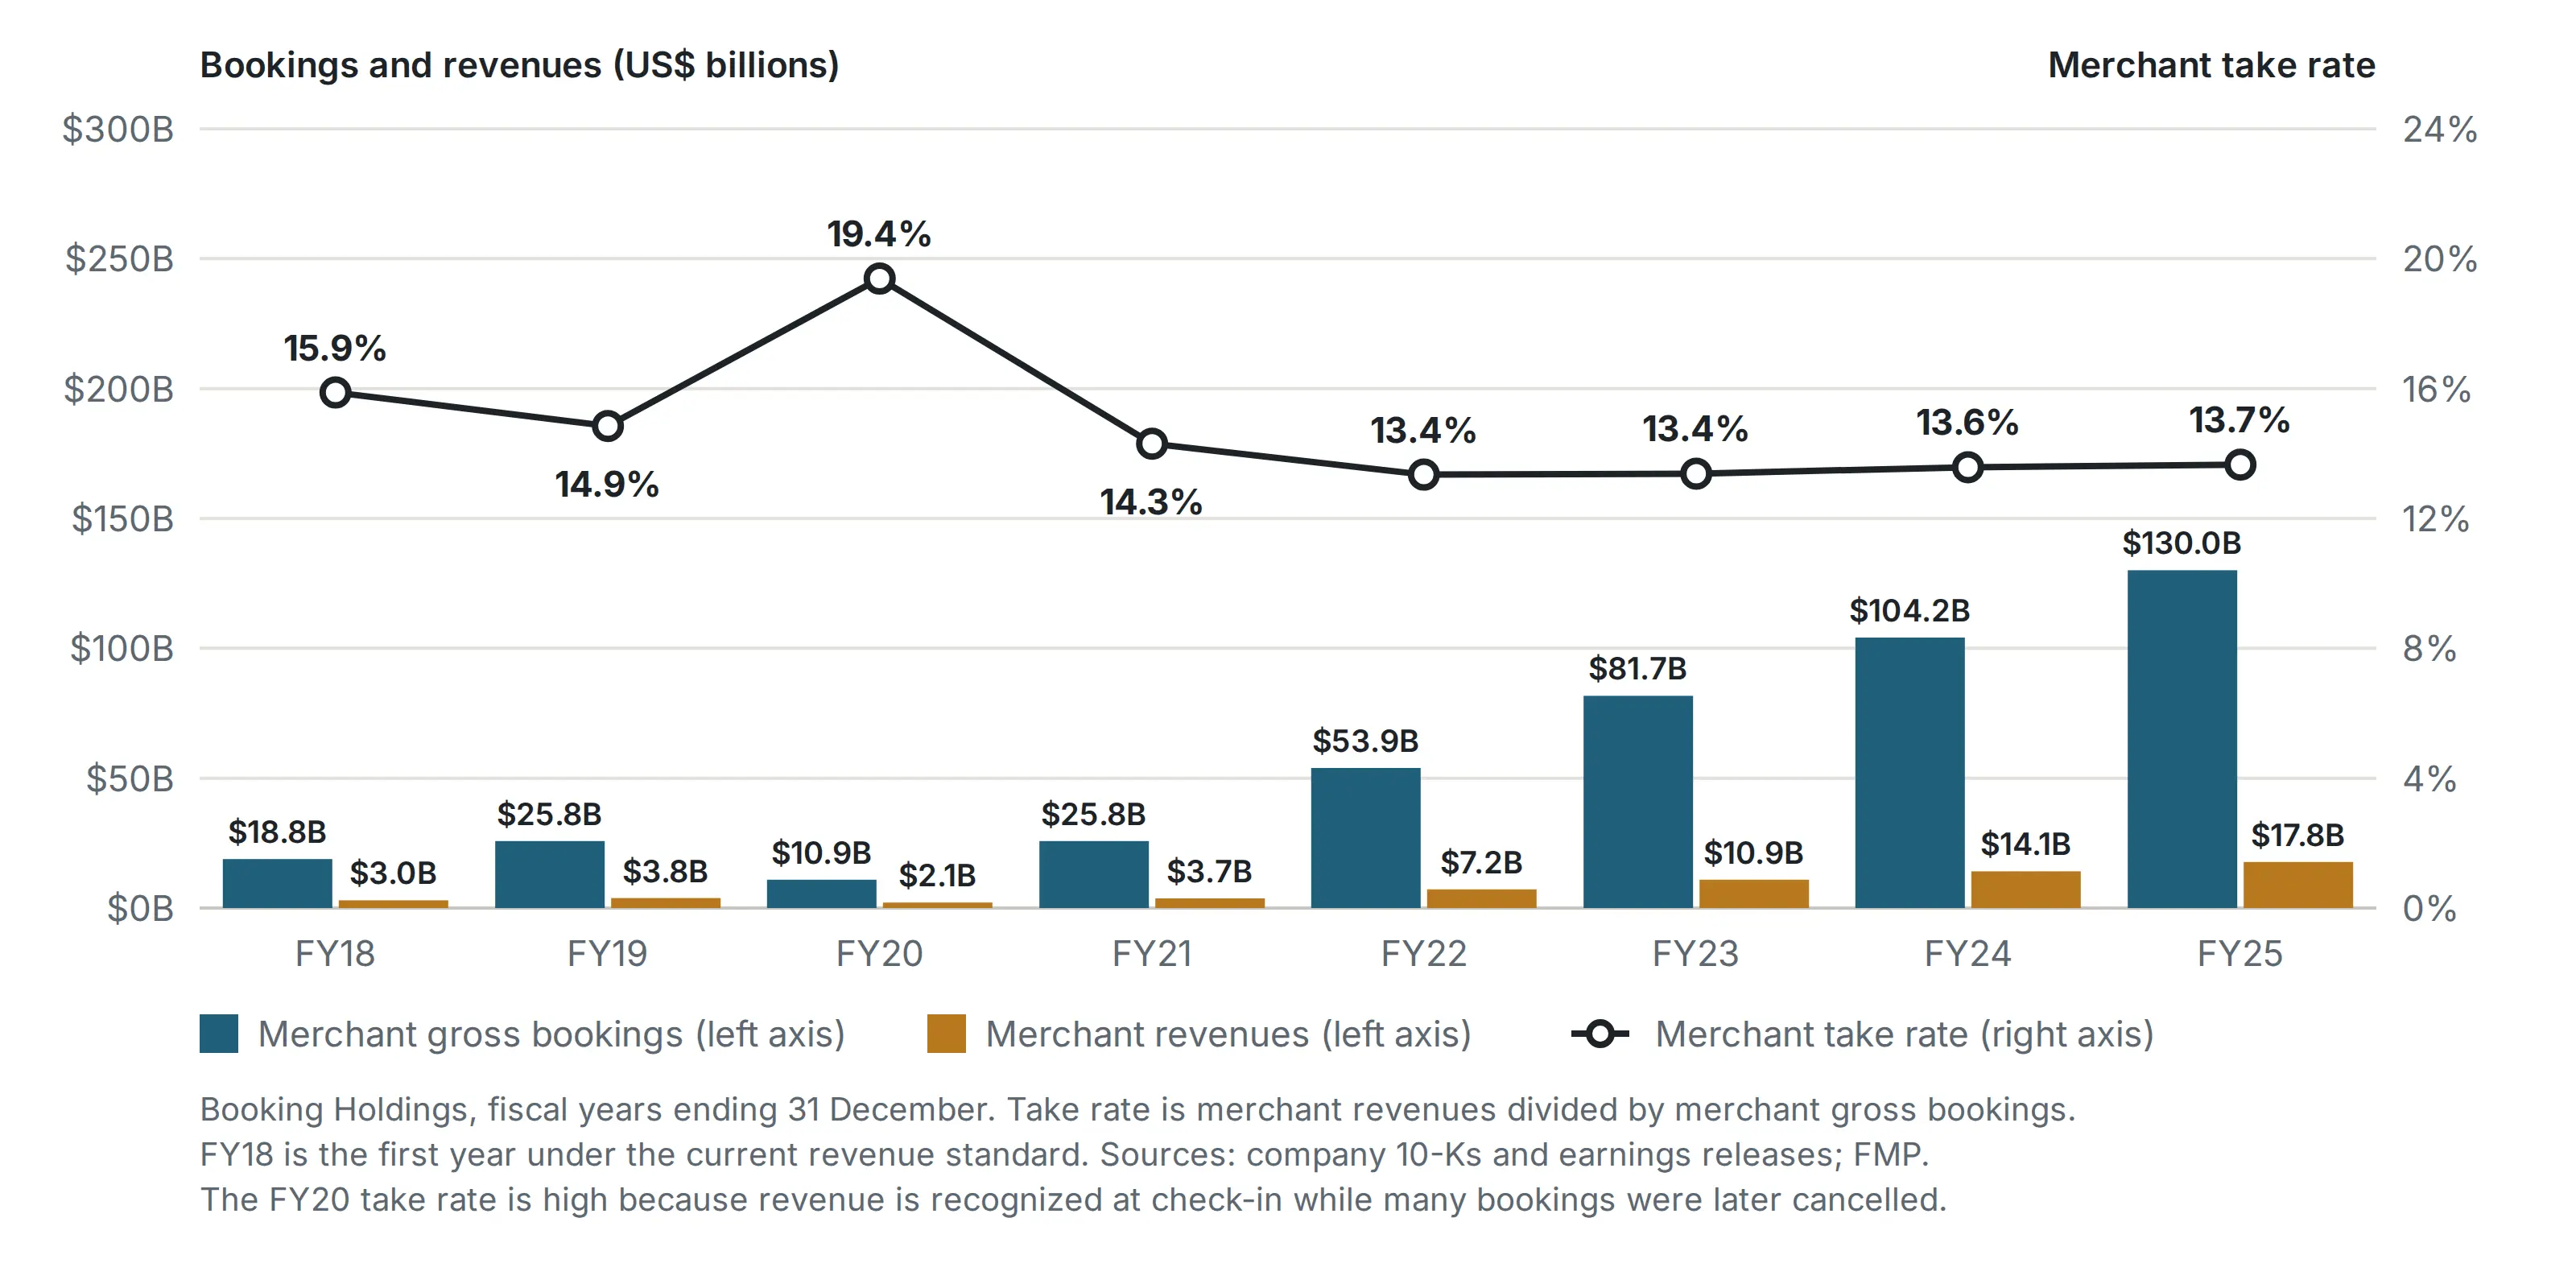
- Take-Rate - The take-rate is the commission percentage that Booking charges for the service of connecting the customer and the hotel, processing the transactions, and providing support on either side to ensure a smooth operational, or travel experience.
Merchant Revenue can be calculated as:
(a) Merchant Gross Bookings
(b) Take-Rate
Merchant Revenue = (a) x (b)
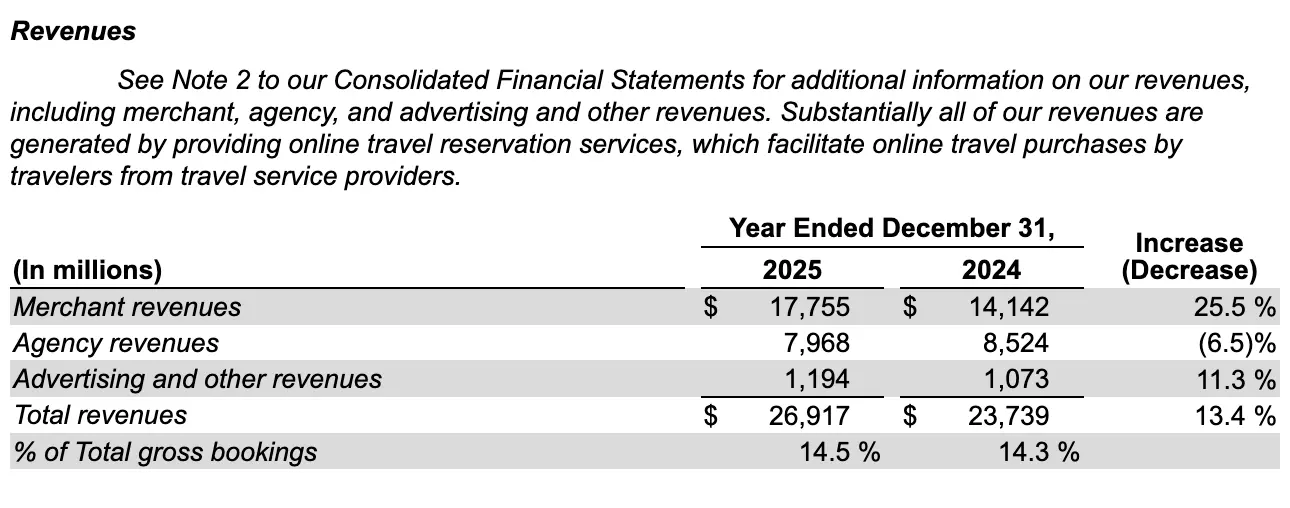
In FY25, the total take-rate, called ”% of Total gross bookings”, was 14.5%. The increase from the prior year was driven by higher payment processing fees, which come with the shift from Agency to Merchant revenue described below. This is slightly overstated, however, as advertising revenue inflates the picture.
Booking Holdings Revenue Segments, FY253
Booking Holdings Inc., Merchant Take-Rates4
The mix between these types of revenue is important to understand for later sections of the report in terms of assessing business quality, competitive positioning, and durability of the marketplace itself. Over the last ten years, the mix has shifted materially towards merchant revenues. In 2017, merchant revenues were roughly 17% of revenues, while in 2025 they were roughly 66%. The gap has continued to widen into 2026, as seen in the Revenue Types chart above. Why Booking made this shift, and what it gained from it, is the second of the three decisions covered below.
Given the nature of revenues, the atomic unit of the business is a room night. Over the trailing twelve months (TTM) to June 2026, Booking sold 1.27 billion room nights on $197.5 billion of gross bookings. We can then determine that each room night carried about $155 of gross bookings (including flights and rental cars), and produced approximately $22.22 of revenue.
How It Got Here - Three Decisions
1. The Origin
Booking.nl, the original site, was founded in 1996 by Geert-Jan Bruinsma, a Dutch final-year university student who noticed that Hilton.com already had an online reservations portal, but could not find a similar one in the Netherlands. He built the Booking.nl site and, out of ignorance, set the business model that later allowed it to win the market against large US corporations: customers paid at the hotels, not on the site, hotels set their own prices, and Booking received only a 5% commission. Bruinsma went door to door in Amsterdam signing up the first hotels. 5
From the beginning, site traffic came primarily from search engine advertising. Bruinsma had tried to place an ad in De Telegraaf, the largest Dutch newspaper, but was refused because he wanted to list a web address rather than a phone number. 5 This dependence on search engines is the subject of the third decision below.
The Booking.nl site was acquired by BookingsPortal in 2003. BookingsPortal was a similar site that ran a “factory” of destination sites for various language travellers. A foreign traveler searching for hotels in a secondary European city would find a site in their native language. The important development at this stage, however, was the intense and systematic A/B testing that the company applied to the landing site.
Booking.com has long been famous for its experimentation and testing culture. You’ll often find figures online discussing how they run over 1,000 tests a day, tweaking, moving things around, showing the customer different information. The BookingsPortal era is where this began. The culture created by BookingsPortal is what eventually resulted in a website that converted browsing travellers at a significantly higher rate than the competition, which in turn justified a higher marketing spend and fuelled growth. 5
In 2004, The Priceline Group’s business development team, led by now CEO Glenn Fogel, purchased a company called ActiveHotels, which was doing a similar thing to Booking.nl, but for independent UK hotels rather than the continental market Booking was going after. About a year later, they purchased Booking and put the two together under the name Booking.com. At the time, each company had about 8,000 hotels on the system with little overlap, so putting the two together greatly expanded the supply of rooms on the sites, thus the value to any single traveller, and thus the value to each hotel on the site individually. 5 This was the moment of the network effect reaching velocity.
An enormous boots-on-the-ground supply expansion campaign followed from 2005 to 2016. Booking aggressively opened local sales and account management offices, primarily in Europe, but also across the globe. This is important to understand because onboarding the current ~500k hotels was a long, expensive and physical process. It is not something a competitor can execute on a short timeline with access to capital alone. Note that ~500k hotels is far smaller than the 4.4 million accommodations listed today. The difference is alternative accommodation, covered in the next section.
2. Shifting To The Merchant Model
The second major decision that built the company was the shift to the Merchant model, which has been happening since around 2017. In the 2000s, the agency model was an advantage. Customers were wary of online payments, so paying at the hotel was preferable and converted at a higher rate. Hotels also preferred it, as they were at the front of the cash flow stream. 5
When Fogel was appointed CEO in 2017, he came into the position with a clear strategy called “The Connected Trip”. The idea was to expand the marketplace into new verticals like flights, rental cars, taxis, attractions, and restaurant reservations, and let customers create personal bundles of them through the site. The company would then use technology to manage the complexities of travel for the customer, like a traditional travel agent. Examples shared by Fogel include automatically shifting a hotel check-in time and re-booking a dinner reservation after a flight is delayed, moving activities around based on weather, and making personal recommendations based on previous travel history. All of that would be bundled into a strong loyalty program with discounts and other travel privileges. The Connected Trip will come up again in the Moat and Risk & Opportunity sections.
Unlike hotels under the agency model, booking a flight requires paying upfront, and bundling discounts across products requires controlling the price. To build out the vision of The Connected Trip, it was “foundational” for Booking to build out its own payment processing fintech branch. 6 The service is called “Payments by Booking”, and for vendors using it Booking handles payments, cancellation policies, fraud, chargebacks, and local currency payment methods on the vendors’ behalf.7
Becoming the merchant of record in a travel transaction also changes Booking’s relationship with the customer. It increases the payment options available to customers and puts Booking in charge of customer support, which builds brand trust and direct usage of the product over time.
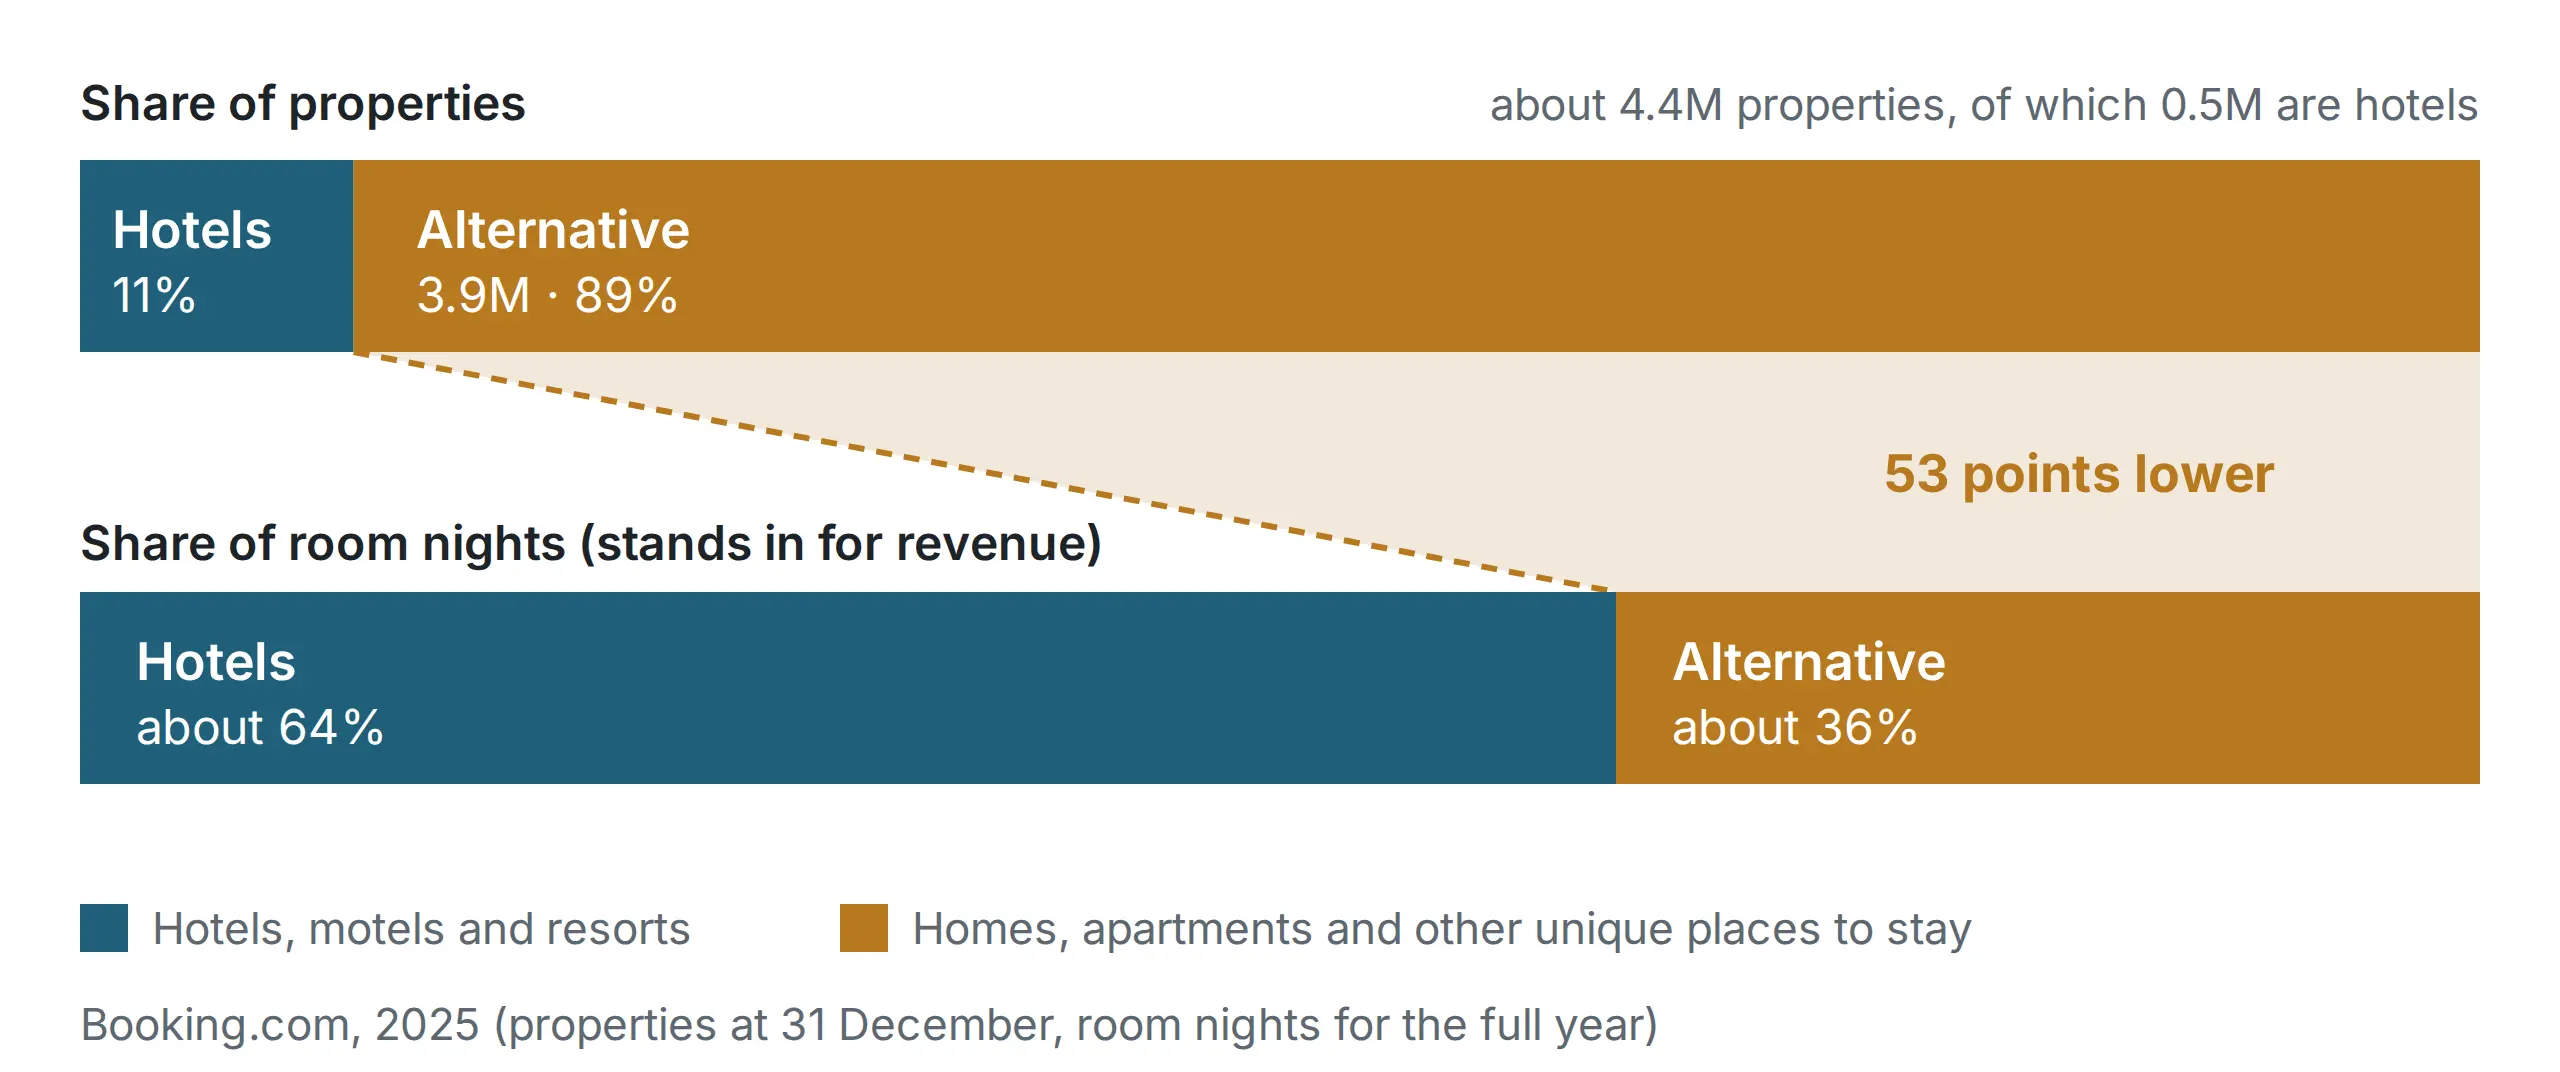
Booking’s merchant model also facilitated another key supply-side growth lever: alternative accommodation. Alt. accommodation became a big focus area for Booking in the 2010s as Airbnb demonstrated the global potential of the market. As of FY25’s year end, roughly 89% of the properties on Booking.com were alternative accommodations, though by our atomic unit of room nights they represent only 40%. This is also what explains the gap between the ~500k hotels and the 4.4 million total properties mentioned earlier. Payments are more significant for alternative accommodations than for hotels. Independent hosts face a lot more challenges than experienced hoteliers in verifying foreign cards, taking foreign exchange gains or losses, or chasing down a chargeback.
Booking Holdings’ Share of Listings vs. Share of Room Nights:8
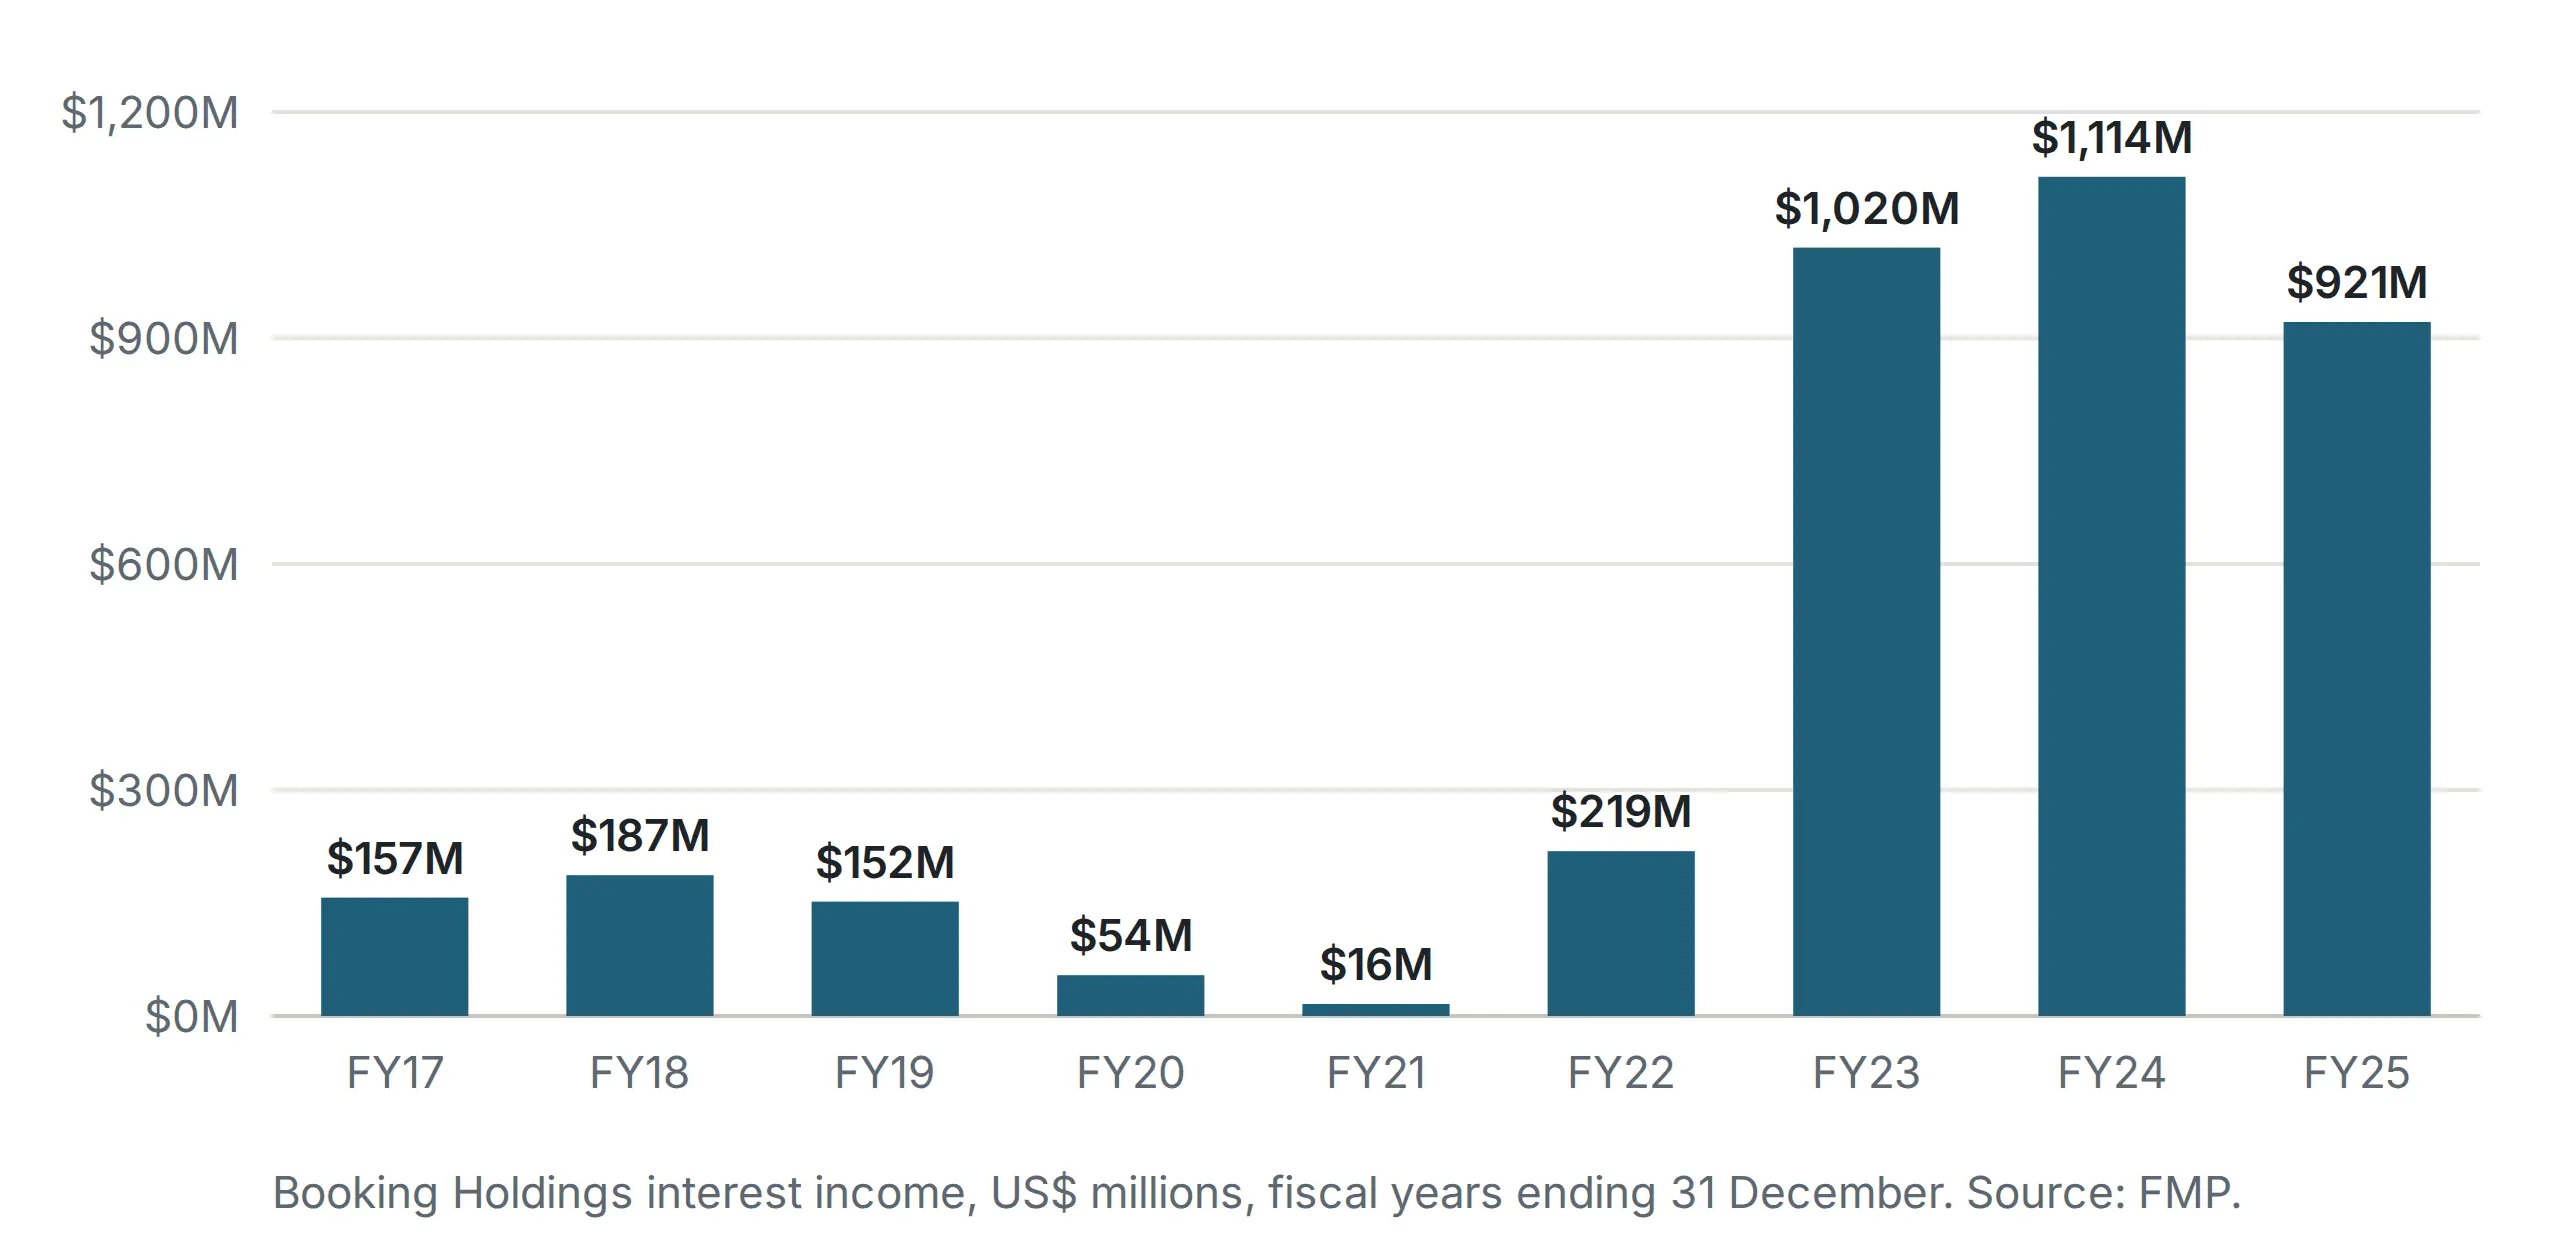
The merchant model is also important because it creates float. Customers’ money sits on the balance sheet between the time the reservation is made and when the customer checks in, funding the operations of the business. It also earns the business interest income, which, along with rate increases, has given net earnings a meaningful boost in the years since the pandemic. This float shows up again in Section 2, where it is the reason Booking’s operating invested capital is negative.
Booking’s Interest Income Since FY17:9
3. Capturing Demand
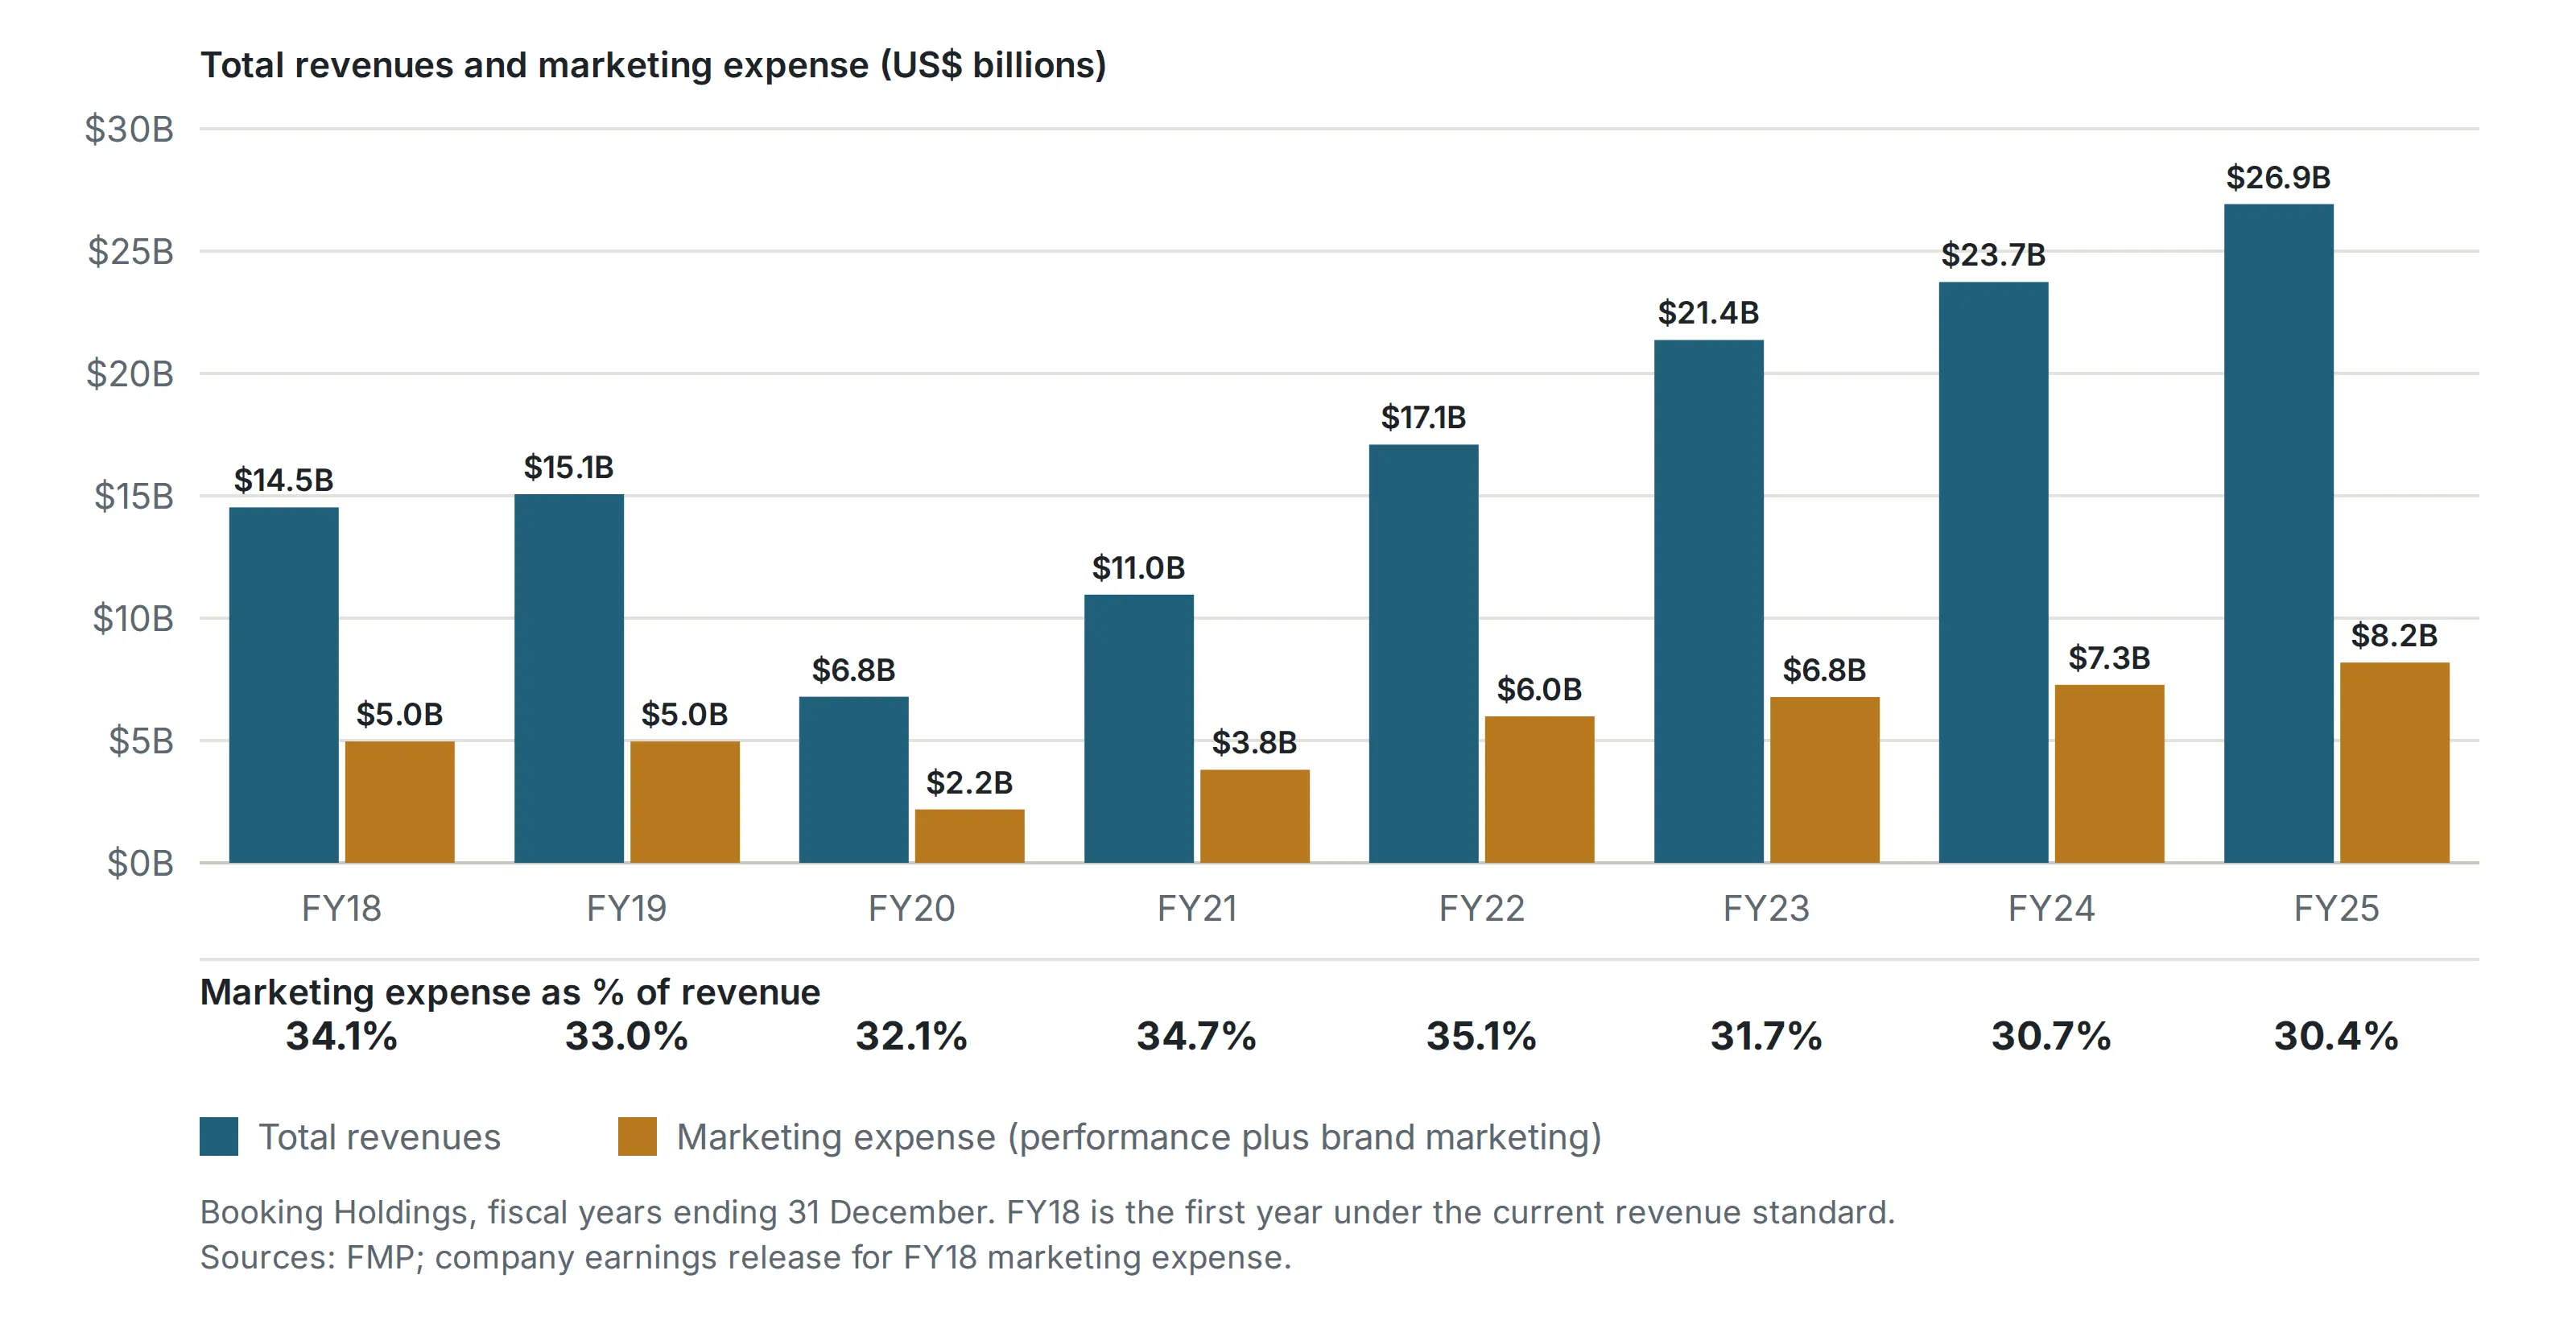
As discussed in the origins section above, Booking.com’s traffic has always been highly dependent on search engine advertising. While the main search engine advertised on in the early 2000s was AltaVista, in the 2010s much of Booking’s budget shifted to Google. The conversion advantage built by the testing culture meant Booking could afford to pay more for each visitor than its competitors. Today, marketing expense is about 30% of revenues, the single largest cost item on the income statement.
Booking Holdings’ Marketing Expense to Revenue:4
The problem was that the shift to Google accompanied the tech giant’s monopolization of search. With few alternatives, Google set the price of advertising, and therefore the price of every traveller Booking acquired. Google has also made several competitive attempts at hotel booking, flights, etc. throughout the years. 10 The last decade of Booking’s strategy, therefore, has revolved around building a direct-booking channel, separating itself from its dependence on Google and making each booking more profitable as a result.
To see why, it helps to split traffic into paid and direct. A room night bought through paid search earns significantly less than the average, and a room night booked by a customer returning directly to the website or app earns much more, because Booking does not have to pay for that visit again. The lifetime value of a customer, therefore, depends on them coming back.
The first tool to build the direct channel is the mobile app. The second is the Genius program, Booking’s loyalty offering. Today the program has three tiers, earned based on the number of bookings made. New accounts are automatically entered into Level 1, while Levels 2 and 3 are achieved by making five and fifteen bookings within two years, respectively. At the time of writing, Level 1 customers get 10% discounts on select stays, while Levels 2 and 3 get 15% and 20% off respectively, along with other benefits.
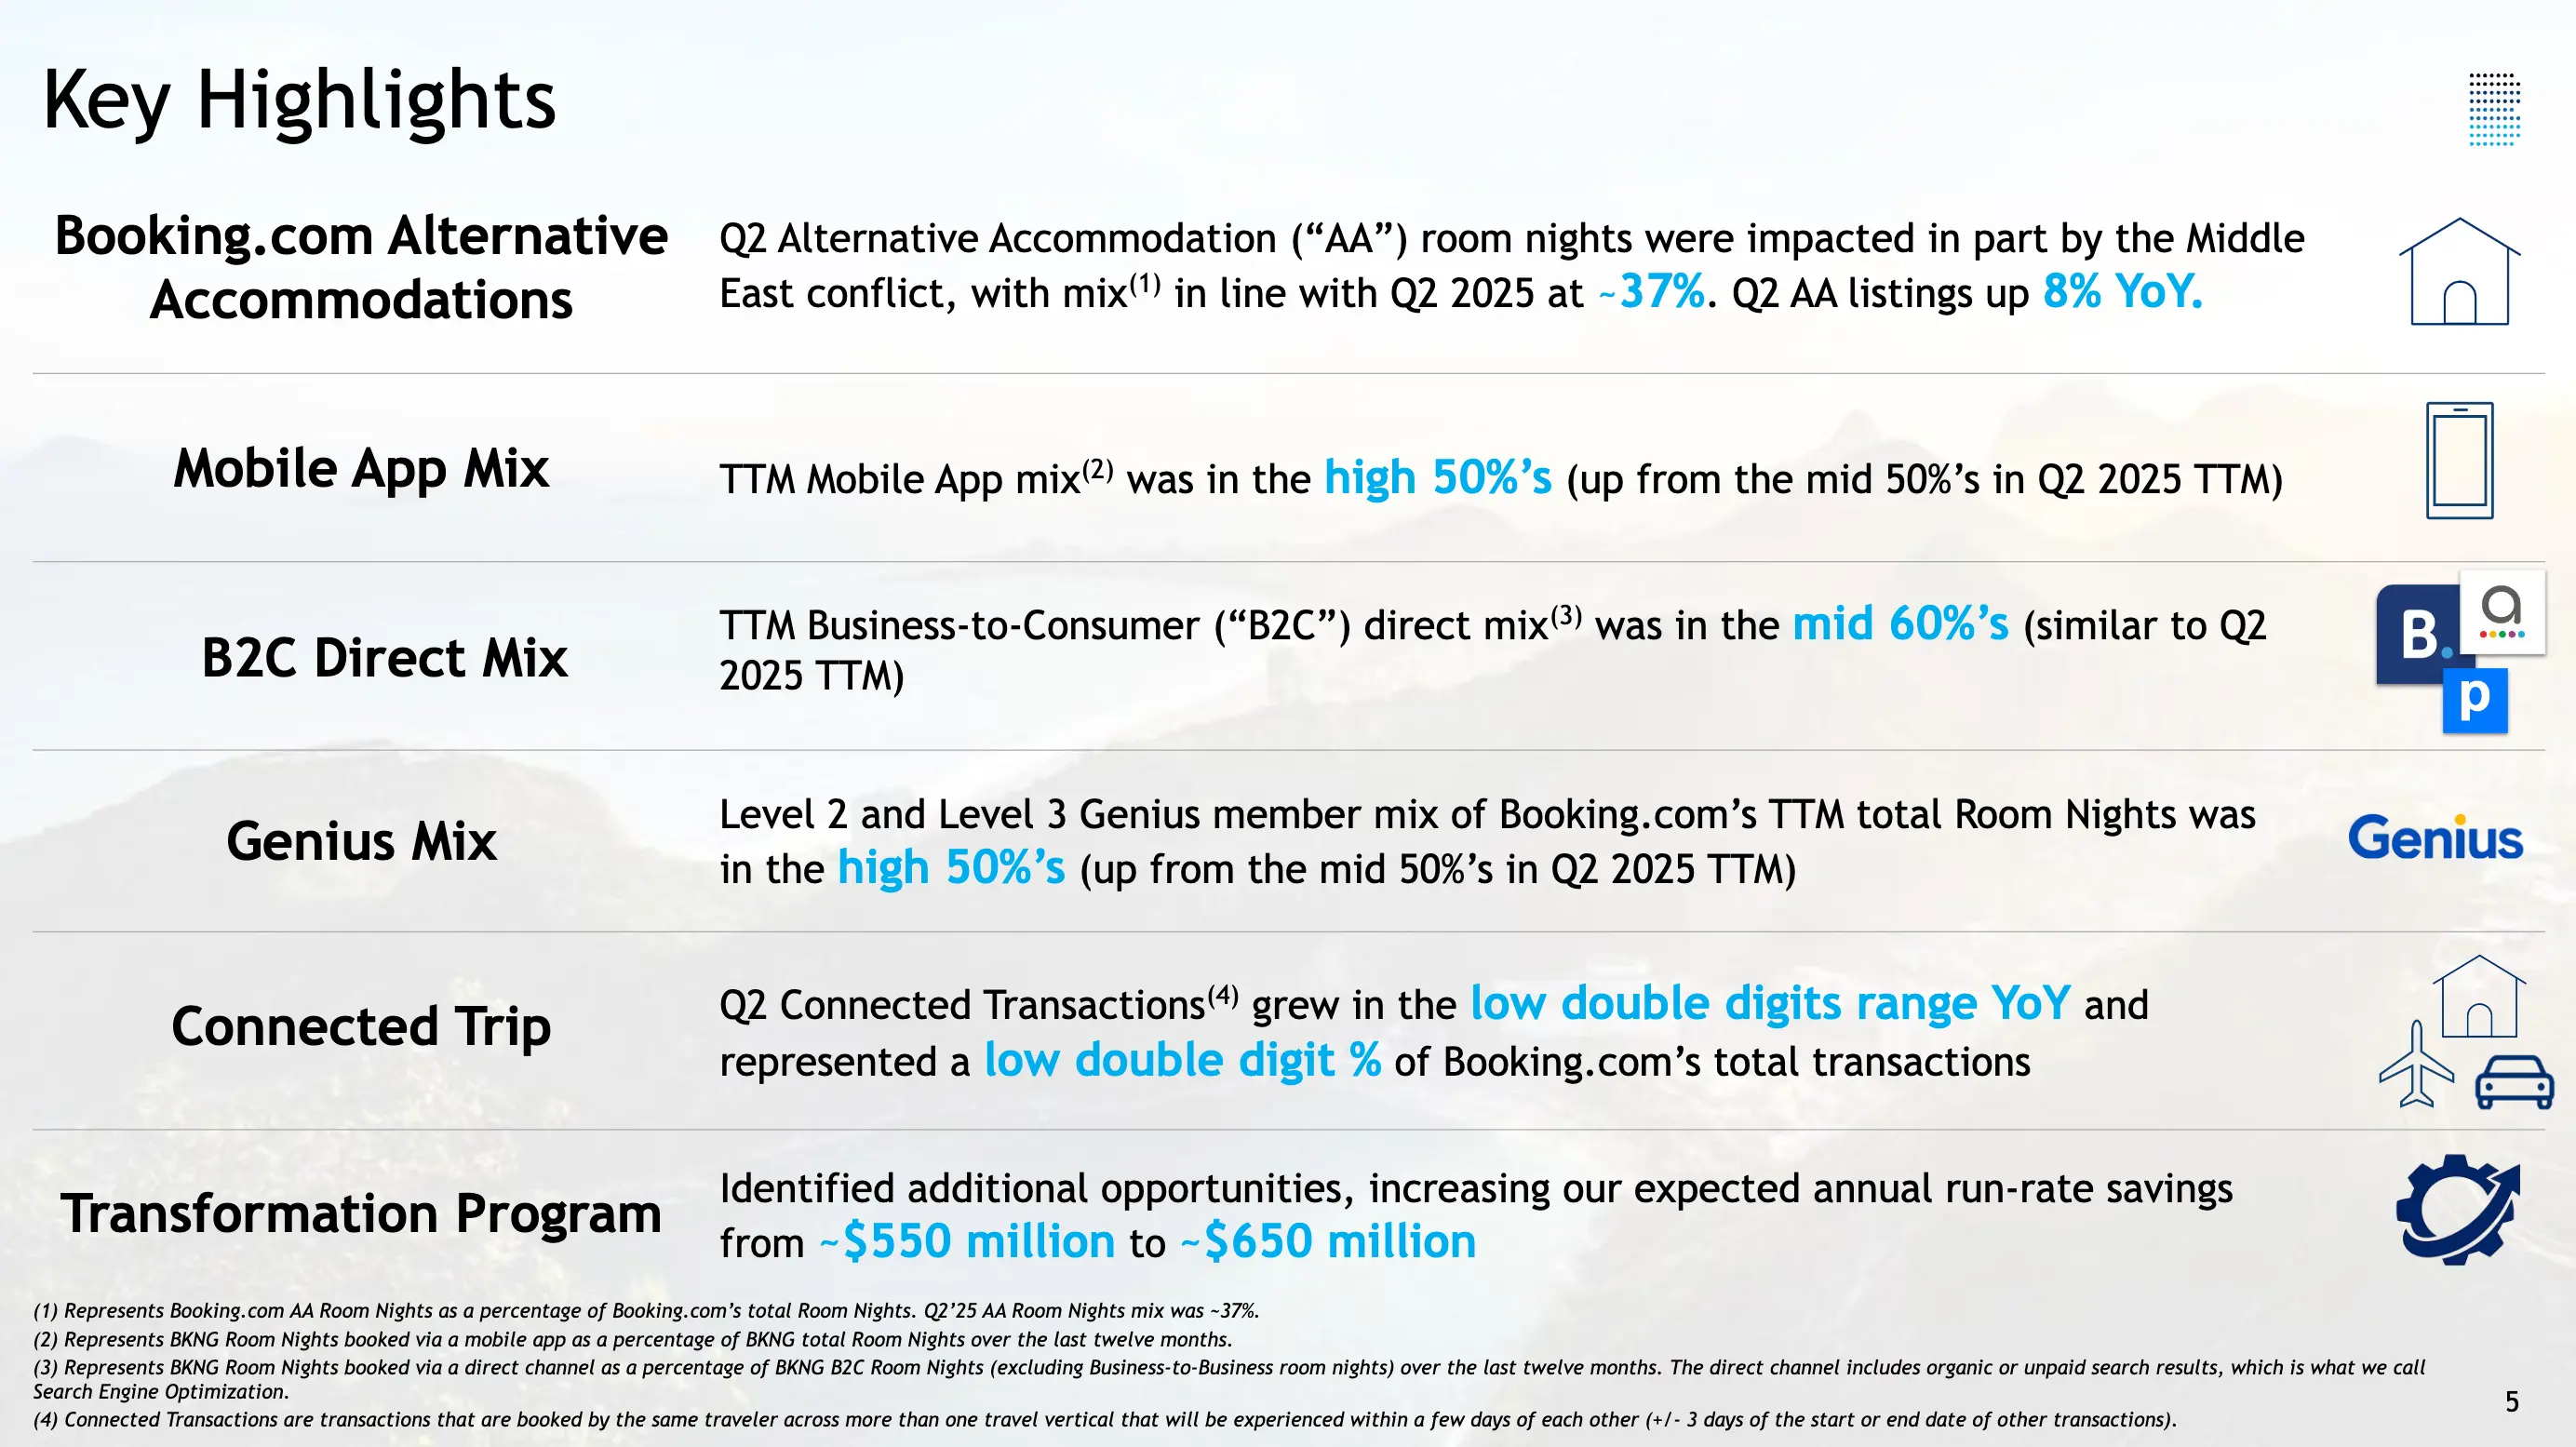
Both levers are working. As of Q2 FY26, on a trailing twelve-month basis, the B2C direct mix was in the mid-60%‘s, mobile app mix was in the high 50%‘s, and Genius Level 2 and 3 members accounted for a high-50s percentage of Booking.com’s room nights.11
Booking Holdings FY26 Q2 Key Highlights11
This is why the direct channel sits at the centre of the current market narrative surrounding the company: will AI agents, used by customers to plan and book their trips, disrupt Booking? If an agent books on the customer’s behalf, the customer may never open the Booking app, and the direct relationship built over the last decade could weaken. This will be discussed in detail in the Risk & Opportunity section.
The Metrics That Matter
With that understanding in place, we can begin to think about the metrics that matter for any owner of Booking Holdings trying to monitor the business’s performance.
- Room night growth - As the atomic unit of the business, the quantity of room nights sold represents growth at the fundamental level. While bookings have expanded into flights, attractions, etc., these are complementary, not principal.
- Take-rate - The take-rate represents Booking’s pricing power and competitive positioning. Personally, my preference is for this to stay flat. A declining take-rate may indicate a weakening negotiating position, while an increasing take-rate, particularly without value adds to the hotels in return, represents rent-seeking behaviour that appears good in the short term but detracts from the brand’s reputation and relationships with its hosts.
- Marketing % of Revenue - Marketing costs represent the cost to acquire new customers.
- Direct Mix - Direct customers are far more profitable than paid customers, for the reasons covered in the third decision above. A shrinking direct mix indicates lower future earnings, while a growing or stable mix, as long as room nights increase, indicates higher future earnings.
- Total Properties or Booking Options - The “moat” of Booking’s network will be discussed in further detail below. In short, however, the value of a marketplace is generally derived from the number of vendors and customers. Growing vendor count provides more options for customers, which attracts more customers, which increases the marketplace’s value for vendors. One caution is that property count flatters the picture. As shown above, alternative accommodations make up 89% of properties but only 40% of room nights, so growth in listings does not translate one-for-one into growth in useful supply.
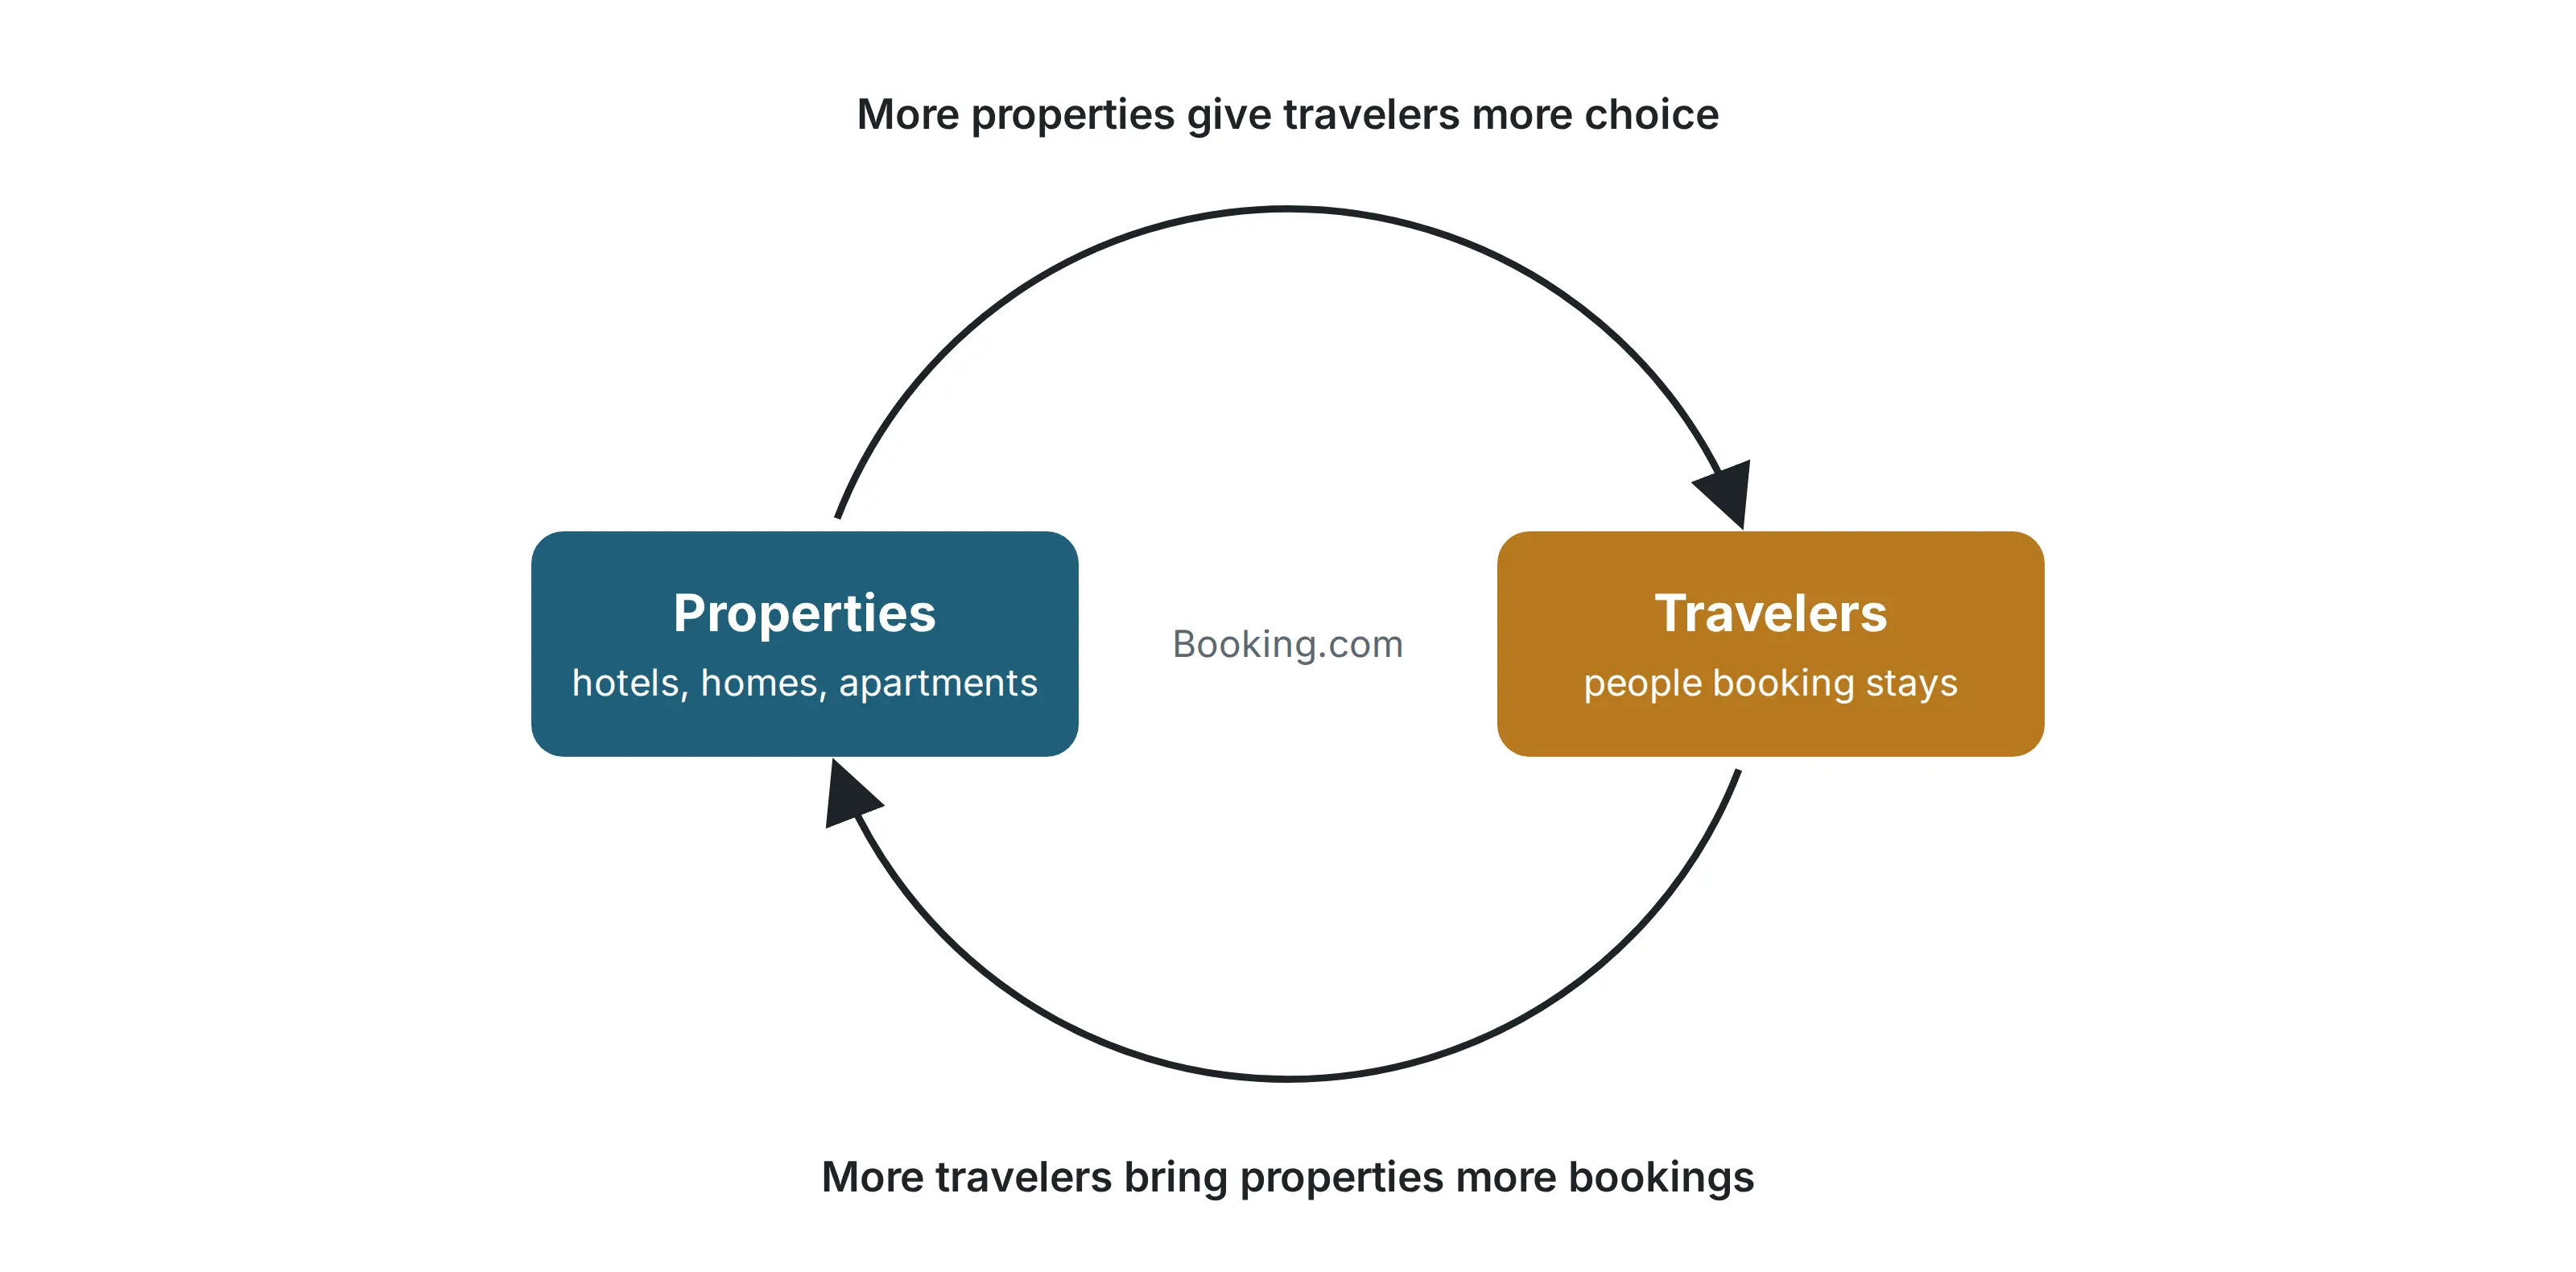
Section 1 Verdict: Value Propositions As a network, Booking has to provide value to two parties. For travellers, Booking provides the widest selection of places to stay globally, with decades of trusted reviews, local payment options, and loyalty discounts. For its properties, it supplies incremental room nights from 220 countries that those properties could not fill alone. For a fixed cost heavy business, those incremental room nights are close to pure profit.
2. Business Quality & Financials
Business Quality
| Metric (TTM to Jun-26 unless stated) | Value | Source / method |
|---|---|---|
| Revenue / gross bookings (take rate) | $28.24bn / $197.5bn = 14.3% | 12 , 13 |
| Adjusted EBITDA margin (SBC not added back) | 30.6% | Q2 6-month ended, 14 |
| Owner earnings / owner-earnings margin | $7.6bn / 26.9% | Appendix A |
| Capex / revenue | 1.1% | 15 |
| SBC / revenue (2025) | 2.3% | 16 |
| Operating invested capital, 31 Dec 2025 | −$4.6bn | Appendix B |
| Owner earnings per diluted share, 2016 to TTM | $2.95 → $9.88 (13.6%/yr) | 17, Appendix A |
| Diluted shares, 2016 to Q2-26 | 1,252m → 770m (−38.5%) | 18, 19 |
Booking Holdings, like many digital businesses, earns high owner-earnings margins on almost no capital. Share-based compensation (SBC) at 2.3% is also good for a technology company. While my owner-earnings calculation (Appendix A) differs from Booking’s Adjusted EBITDA, the company does include SBC as a cost in the metric management is measured against, indicating a management team that understands its real economic cost.
While I typically like to use return on invested capital (ROIC) to judge business quality, for Booking, when you consider that operating invested capital is negative, the ROIC metric as a whole becomes meaningless. ROIC is typically measured as Net Operating Profit After Tax (NOPAT) divided by Operating Invested Capital. Under normal circumstances, it answers the question of how much profit the business makes each year, for each dollar that was historically invested into it by investors. If Operating Invested Capital is negative, the calculation returns a negative number for a business that is highly profitable.
Fundamentally, we don’t need ROIC to understand Booking’s quality because Operating Invested Capital is negative. This is the float from the merchant model showing up on the balance sheet. Customers, hotels and other suppliers fund the day-to-day operations of the business, not shareholders or lenders (see Appendix B). Growth in Booking’s earnings is therefore not dependent on investing more capital, but simply on demand for its service, which simplifies the analysis. The risk with this kind of business is that the float, made up of customer deposits, unwinds if bookings stop growing.
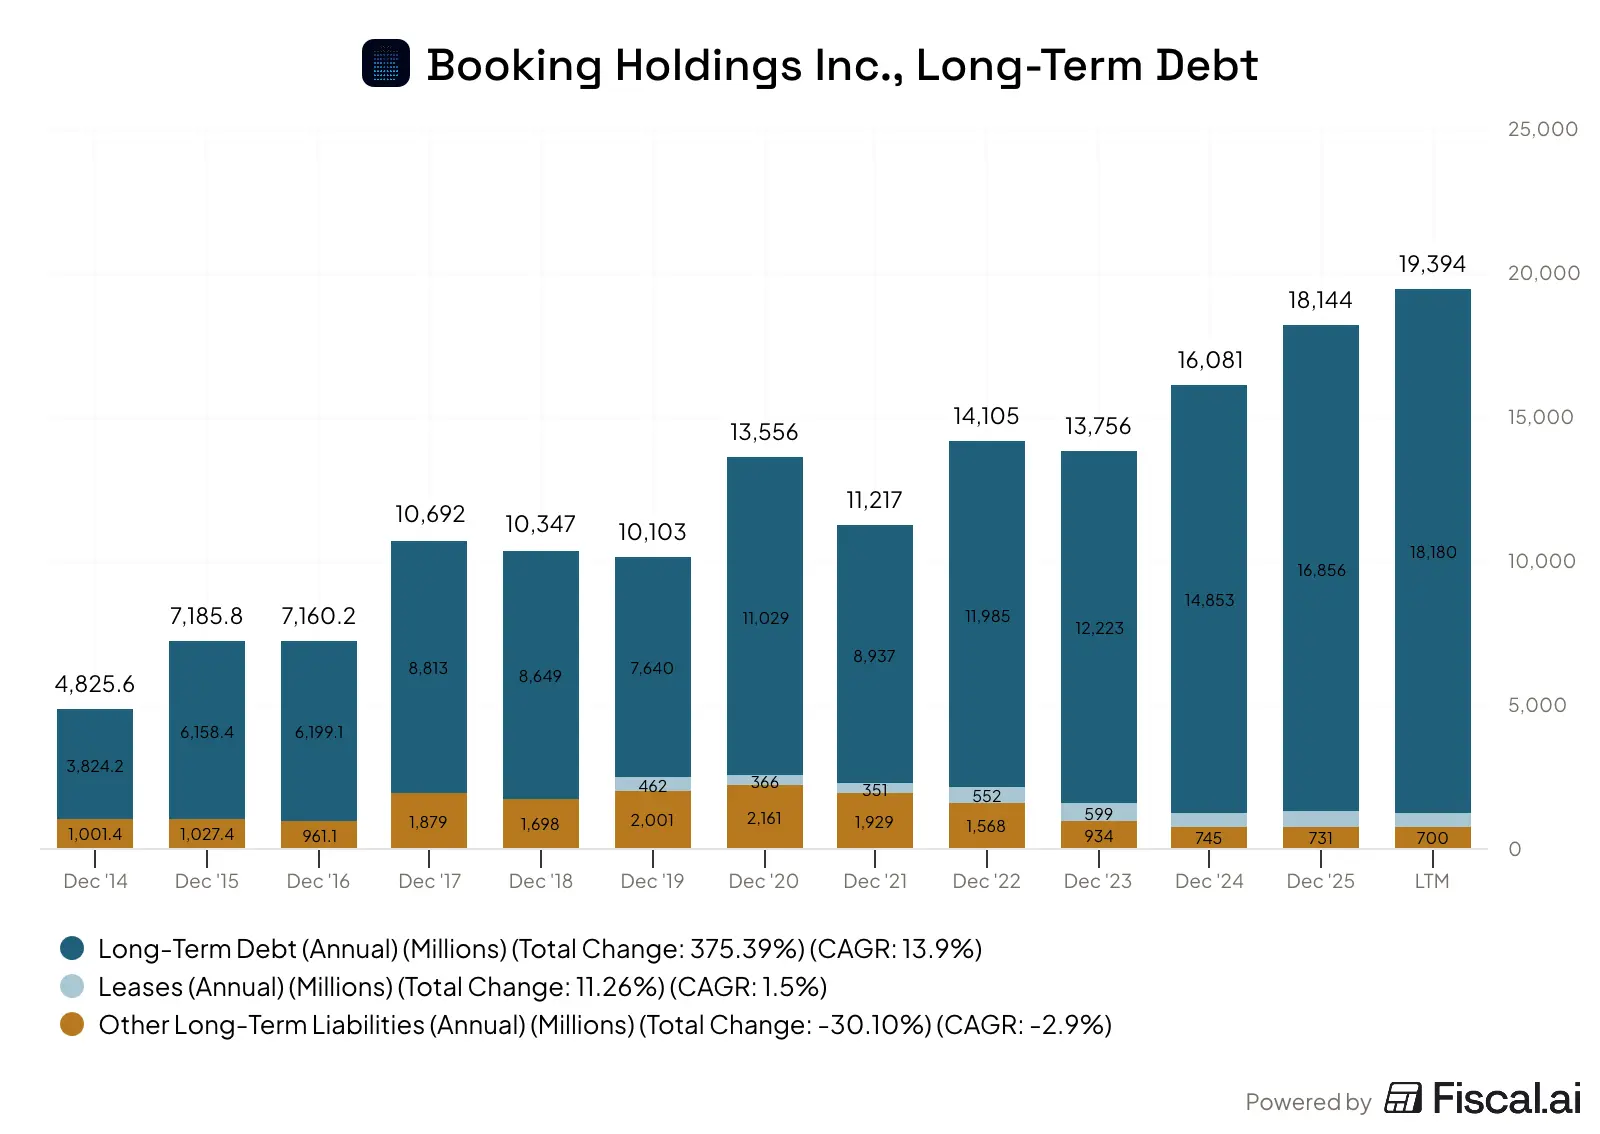
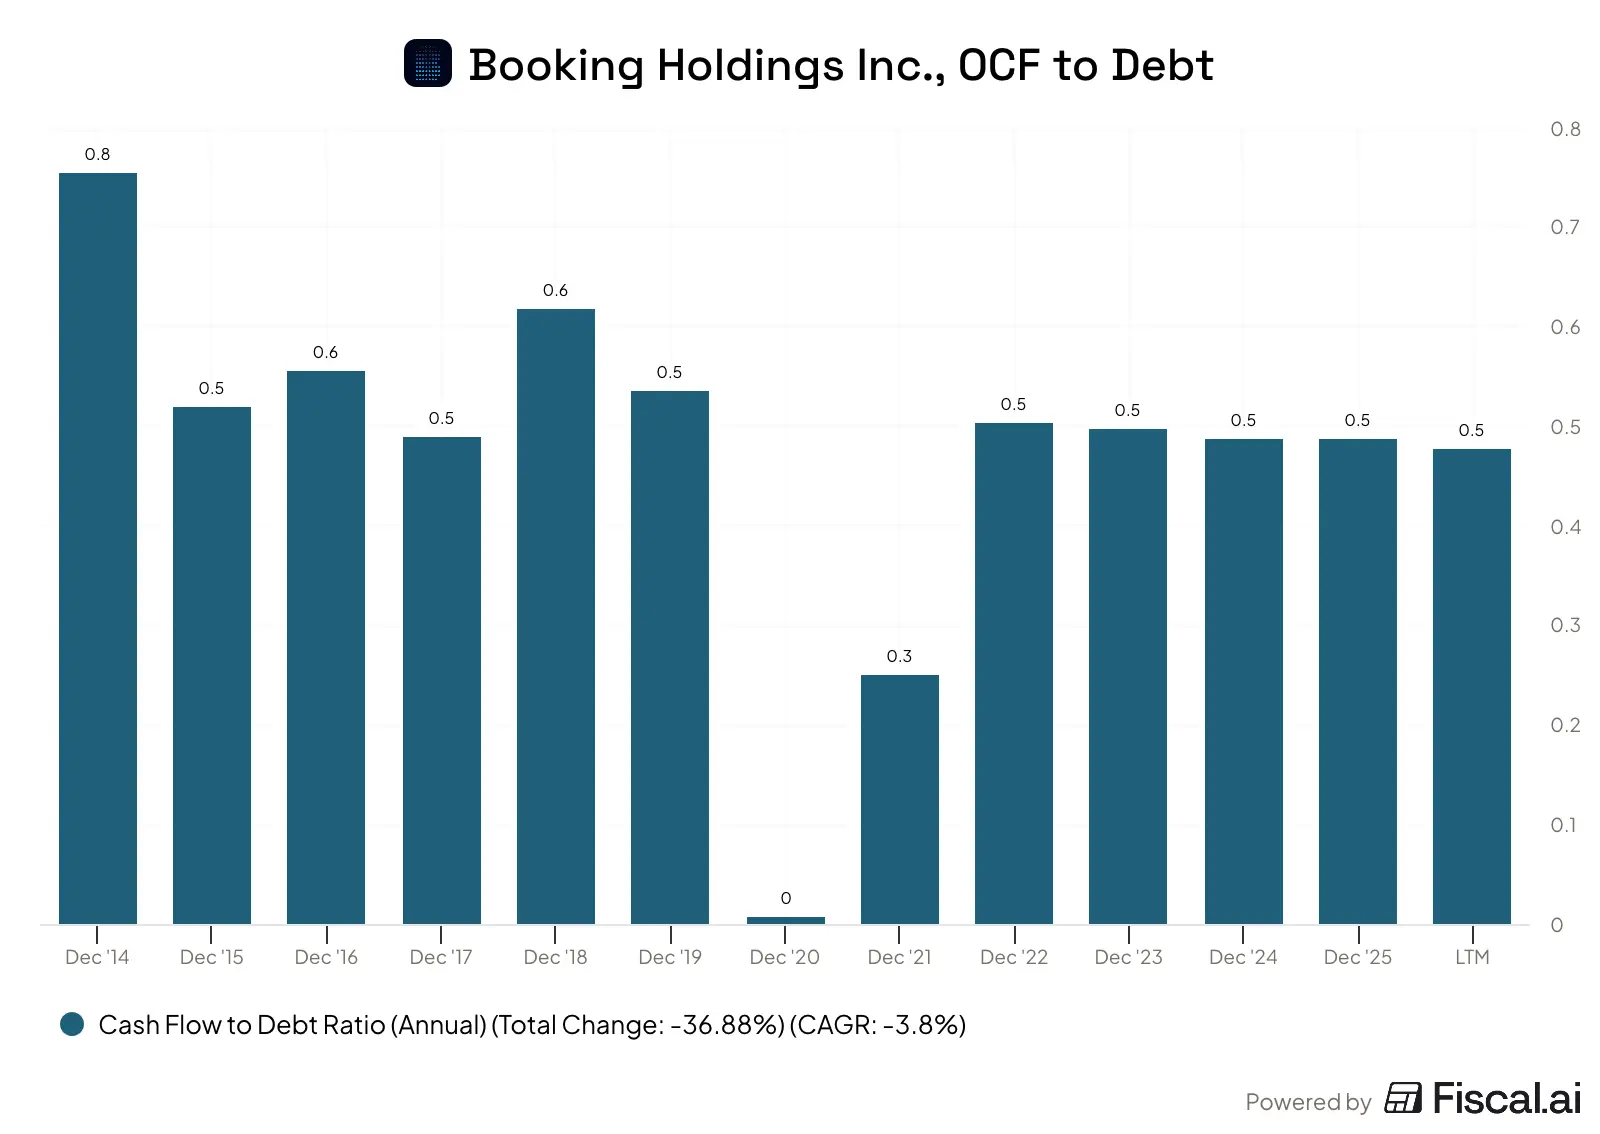
Long-term debt is not an issue either. Debt has risen steadily over the prior periods, which may expose the company to higher interest payments in a period of rising rates. However, when compared against operating cash flow, debt levels have remained flat and completely manageable. An OCF/Total Debt ratio of 0.5 means the entire long-term debt balance could be paid off with two years of organic cash generation.
Booking Holdings, Long-Term Debt
Booking Holdings Inc., Operating Cash Flows to Total Debt
Financials
Similar to ROIC, GAAP earnings are a poor indicator of the earnings power of Booking. The nature of the business means GAAP earnings obscure the economic reality of the business. For this reason I calculate Owner Earnings in Appendix A. Repeating the same methodology across the past decade, we can see the following trend.
Booking Holdings’ Owner Earnings, FY16-TTM Q2 FY26
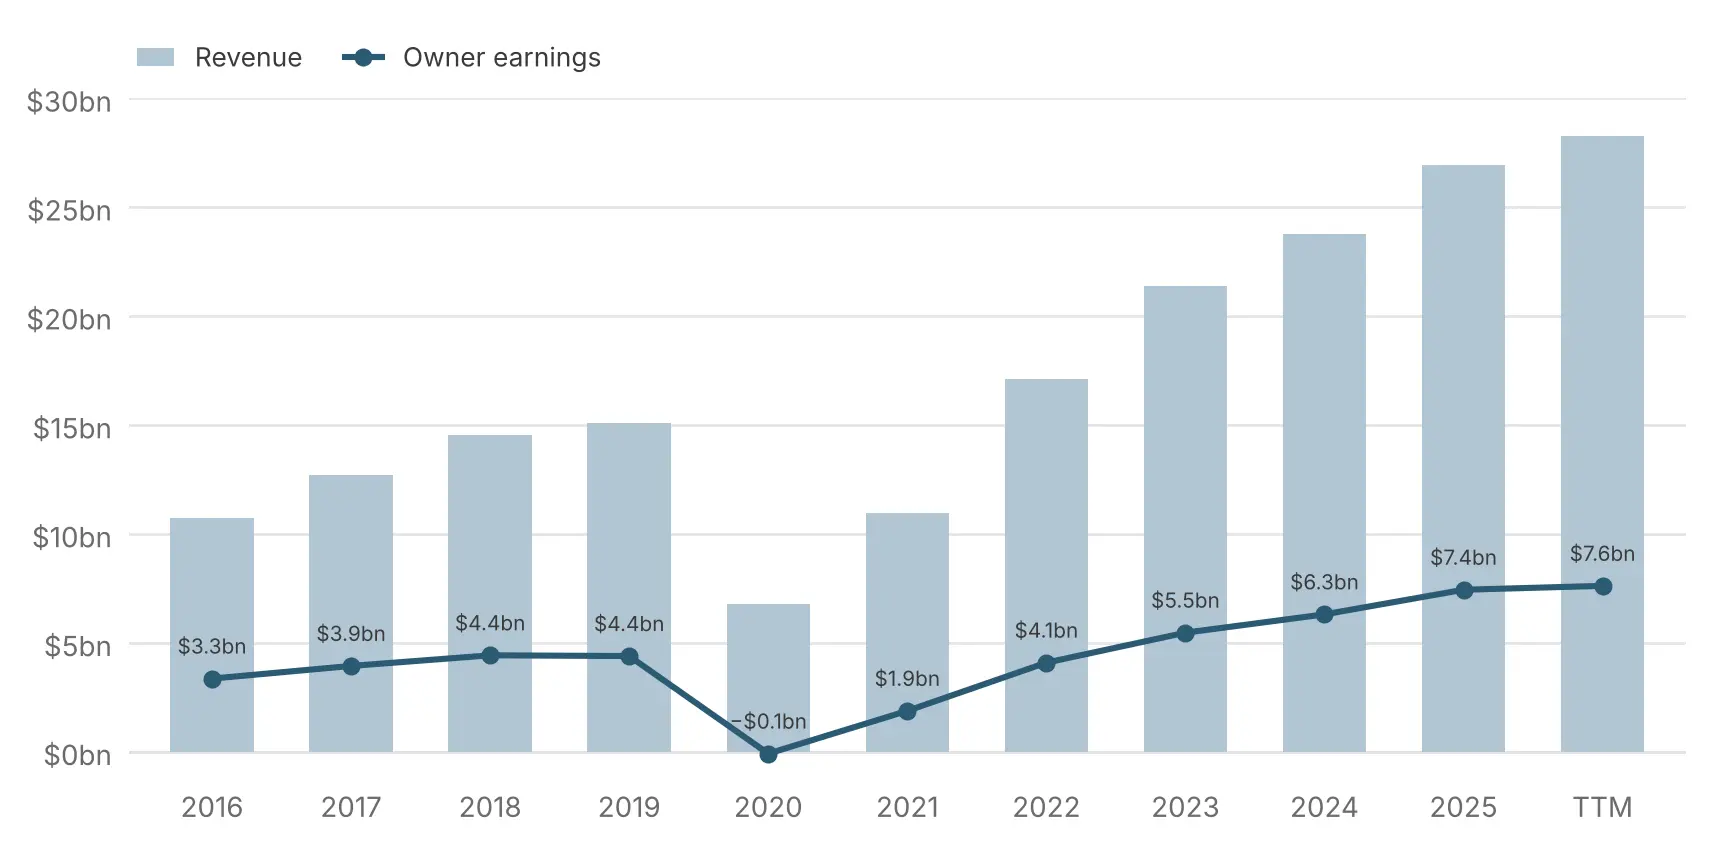
Revenue growth has been extraordinarily consistent and strong since coming out of the pandemic in FY20. As covered in Section 1, most of this growth comes from Merchant revenue, which adds payment processing fees and merchant of record responsibilities to Booking’s operations, in turn allowing it to offer more value to suppliers and reach more travellers.
Owner earnings have also kept pace with revenue growth. Notably, FY20 shows how the business behaves during down periods. Booking essentially broke even in the worst travel year in decades because most of its cost structure is variable expense that shrinks with revenue. That means, as an owner, it’s very hard to lose money with Booking at the business level. The larger risk is the price paid for the shares, which is covered in the Valuation section.
We can build a waterfall chart from FY16 to FY26 TTM to understand where earnings growth has come from.
Booking Holdings’ Owner Earnings Growth Waterfall, FY16-FY26
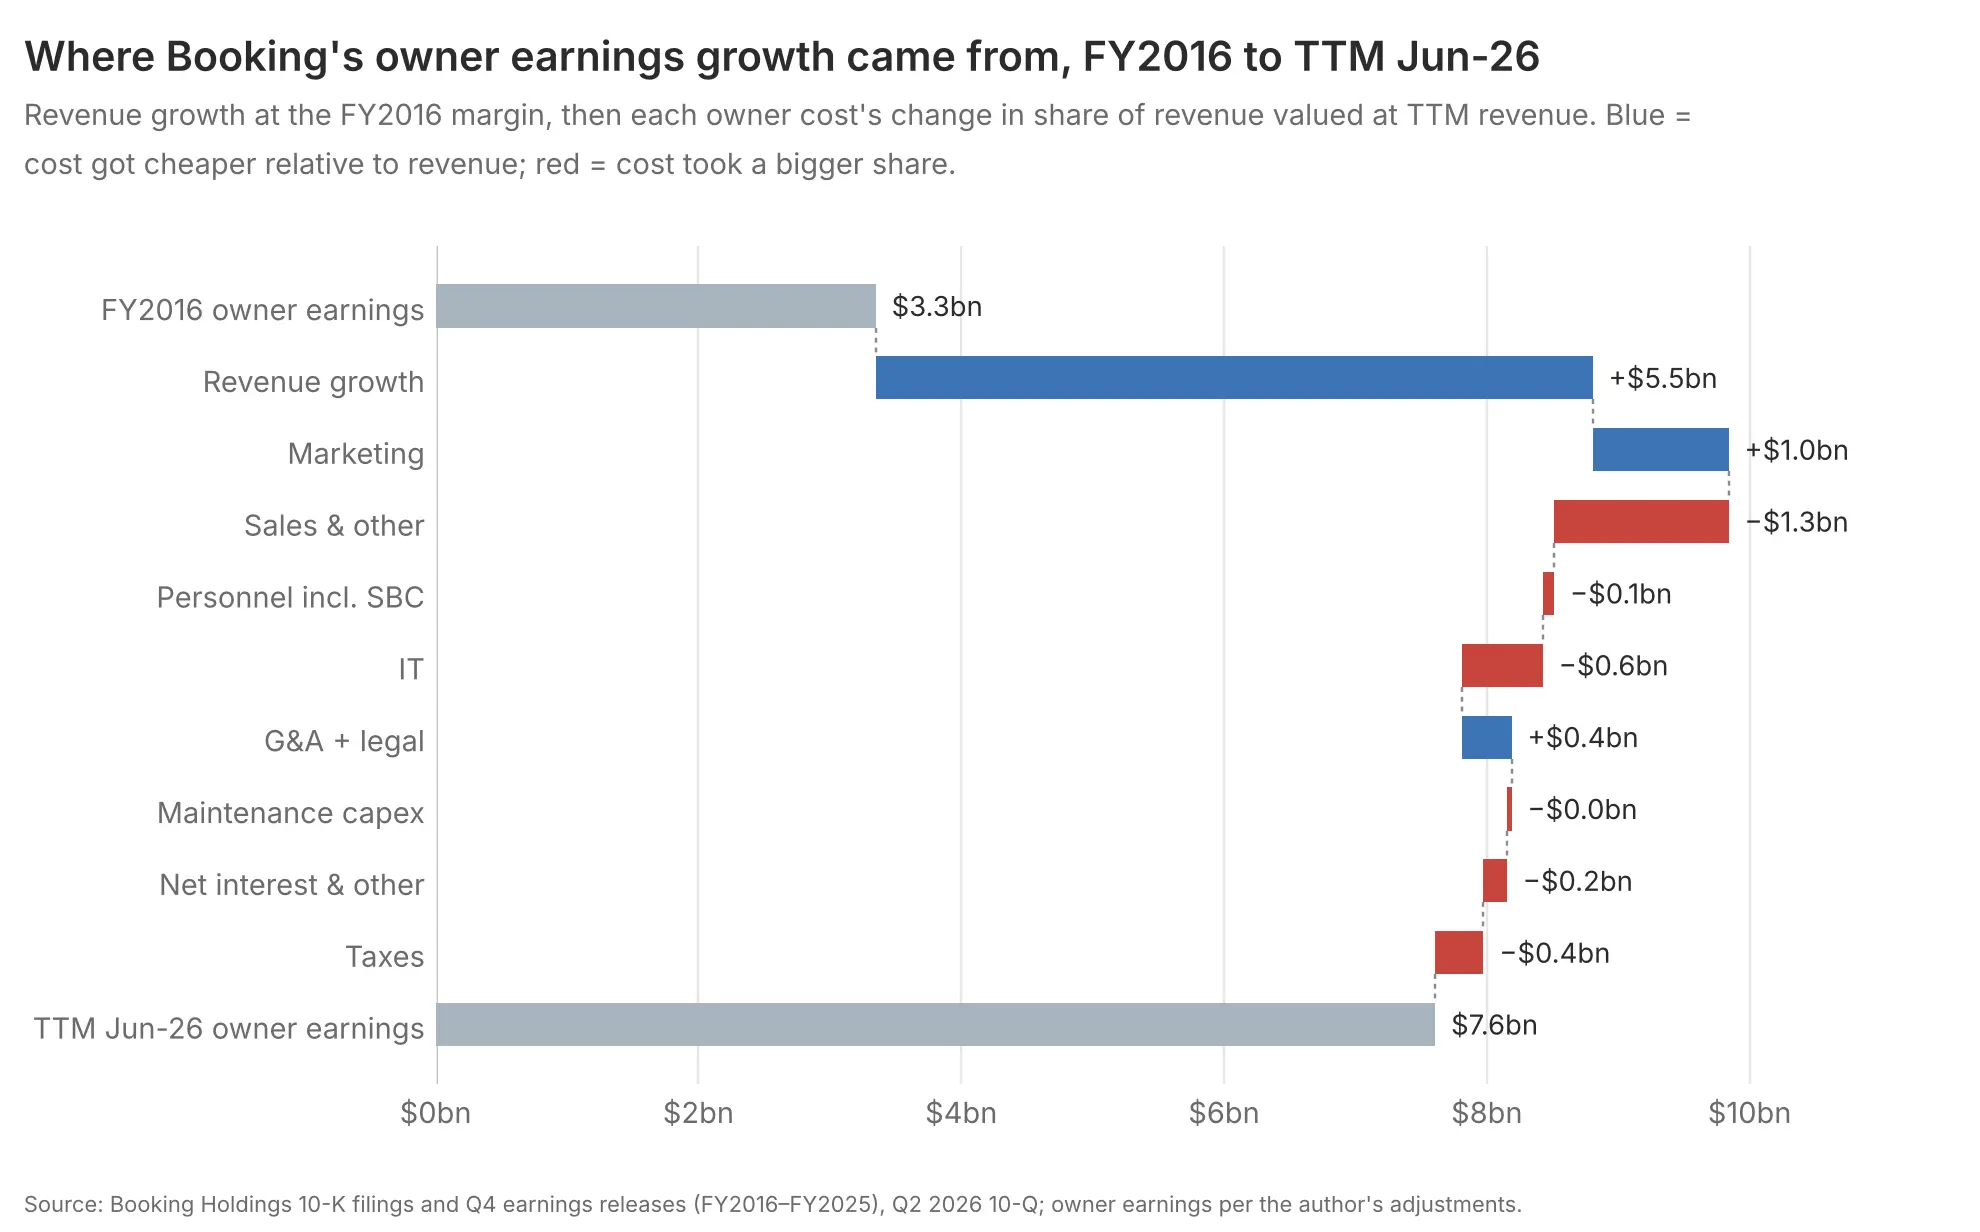
The vast majority of owner-earnings growth over the past decade has come from revenue growth, reflecting the commission-based model. Sales costs and IT expenses have outpaced revenue growth in the meantime. The increase in sales costs is the cost side of the Merchant model shift from Section 1. As Booking becomes more deeply integrated in facilitating travel between the traveller and the accommodation provider, it also takes on payment processing fees, fraud prevention and chargebacks, customer service and third-party call centre fees, etc. 20
Marketing cost savings are the other side of the third decision from Section 1. The decline in marketing expense relative to revenue has corresponded with the increase in direct bookings through the mobile app and stand-alone site. Direct bookings do not require performance marketing expenses, and are thus materially more profitable than paid bookings. Beyond growing total bookings, increasing the mix of direct bookings is the single biggest thing Booking Holdings can do to increase profits. It is also the part of the business the market fears AI agents will threaten, which is covered in the Risk & Opportunity section.
On a total company level, owner earnings have compounded at ~8% a year since 2016. On a per share basis, owner earnings have grown faster, at ~13.6% a year, because a substantial amount of the business’s free cash flow has been directed towards open-market buybacks, reducing diluted shares by 38.5% over the period. We will analyze the execution of these buybacks in the management section below. On first appearance, however, the combination of organic and buyback growth appears excellent.
Booking Holdings Per-Share Owner-Earnings
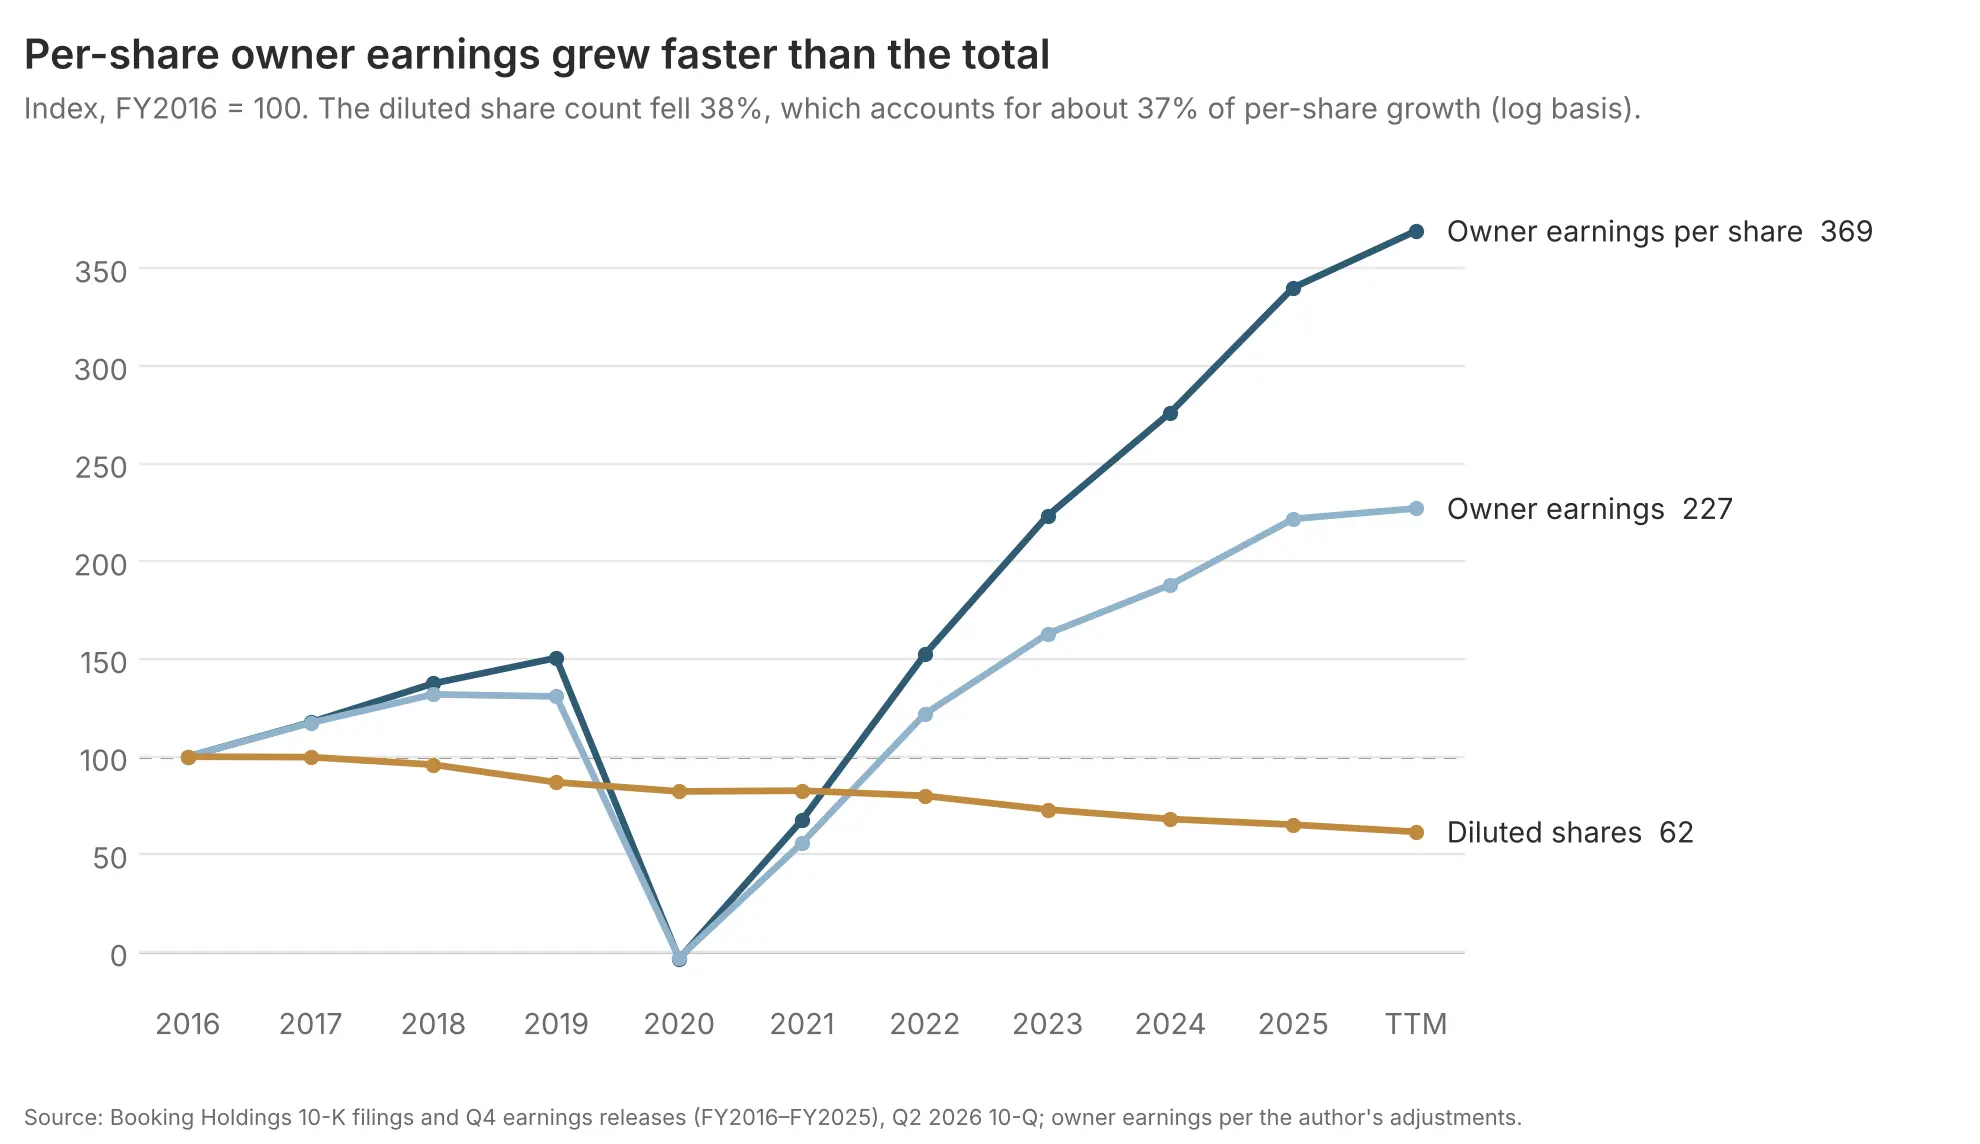
Section 2 Verdict: Quality Rating Exceptional. Booking earns a near 27% owner-earnings margin on negative operating capital, with 13.6% annual growth in owner earnings per share since 2016.
3. Moat Analysis
4. Risk & Opportunity Framework
5. Management & Capital Allocation
6. Valuation
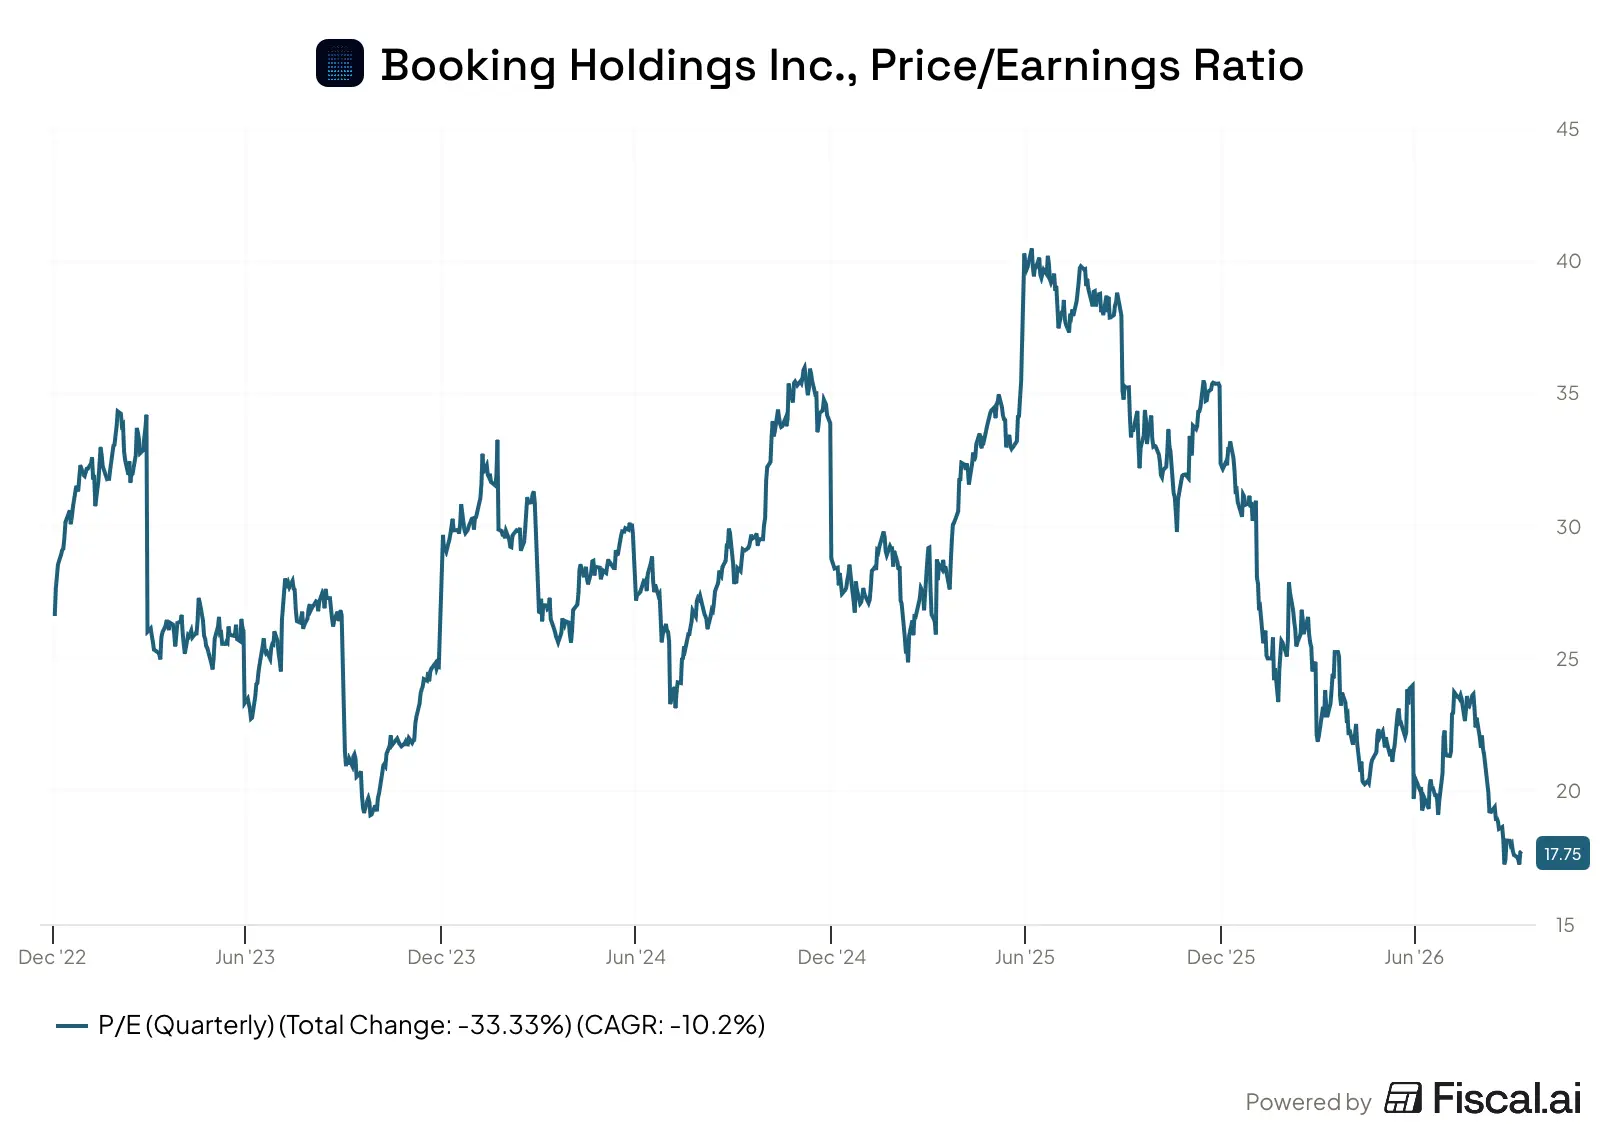
As of the time of writing, the stock has sold off to its cheapest level in years, as the market weighs the threat of AI agents booking on a customer’s behalf.
Booking Holdings Inc., Price/Earnings Ratio, October 2026
7. Investment Judgement
Appendix
Appendix A - Owner Earnings
Owner Earnings is a concept first put forward by Warren Buffett (to my knowledge) in his 1986 letter to shareholders. The idea is that GAAP earnings, EBITDA, free cash flow, or other earnings-related measures do not fully represent the cash generative ability of a business. To correct this, an investor can calculate “Owner Earnings”, in other words the excess cash a business generates that can either be reinvested into growth or returned to the owners of the business. Fundamentally, it answers the question: how much would this business earn if it stopped trying to grow, and only tried to hold its current market share?
Owner Earnings Adjustments
Owner Earnings is calculated from the following components:
- (a) Reported earnings
- (b) Normalizing adjustments
- (c) Depreciation, amortization, and certain other non-cash charges
- (d) The average annual amount of capitalized expenditure for plant and equipment that the business requires to fully maintain its long-term competitive position and unit volume
- (e) Any increase in working capital required to hold that position and volume
Owner Earnings = (a) + (b) + (c) − (d) − (e)
Owner Earnings TTM-June FY2621
| Item | $M |
|---|---|
| GAAP net income | 7,209 |
| Normalizing Adjustments | |
| Remove non-operating items (equity securities, Euro-debt FX) | (354) |
| Add back transformation (restructuring) costs | 187 |
| Replace reported legal/regulatory/tax items with 4-yr average | (328) |
| Remove one-time repatriation tax adjustment | 79 |
| Capitalize relationship-building marketing (net of amortization) | 212 |
| Capitalize growth R&D (net of amortization) | 18 |
| Tax effect of adjustments | 58 |
| D&A and Other Non-Cash Charges | |
| Add back depreciation | 404 |
| Add back intangible amortization & KAYAK impairment (net of tax) | 526 |
| Maintenance Investment | |
| Less maintenance capex | (404) |
| Less maintenance working capital | - |
| Owner earnings | 7,608 |
| Owner earnings per diluted share | $9.88 |
| Owner earnings yield (at current market cap) | 6.3% |
| Price / owner earnings | 16.0x |
Material Adjustments Explained:
- Remove Non-Operating Items - Equity and foreign exchange gains/losses are accounting measures, not operating.
- Transformation Costs - Management is undergoing a large multi-period transformation program that they expect to materially lower future operating costs.
- Legal/Regulatory/Tax items - These are complex expenses and gains that vary in terms of materiality and nature year-to-year. Booking removes them from their own adjusted measures. However, they are real economic costs and appear each year. I adjust for the 4-year average rather than ignoring them completely.
- Relationship Building Marketing - Booking’s largest cost item is marketing. The large majority of this comes from performance marketing, primarily on Google and social media.22 Simultaneously, the share of total room nights booked by customers coming directly to Booking.com was a mid-fifties percentage in 2025.23 We can conclude that some portion of performance marketing creates a customer relationship asset, where that customer returns directly for their next booking needs. This is not represented in GAAP standards, but is a true economic benefit of marketing expense. For the adjustment above, we assume that 90% of Booking’s marketing expense goes towards performance marketing, and that 20% of that spending creates a customer relationship asset. We also assume that relationship has a 3-year useful life. Thus, for each of the past three years, we capitalize 20% of Booking’s performance marketing, and then amortize it over the assumed useful life. A similar exercise is performed on the remaining 10% of marketing costs spent on brand marketing. Full details can be found in the worksheet linked.24
- Intangible Amortization and KAYAK Impairment Charges - Again, these are accounting charges. Amortization of acquired intangibles and impairment charges are relics of cash that was paid several years ago.
- D&A and Maintenance Cap. Ex. - This is slightly pedantic for a low cap-ex demand business like Booking. But for completeness, we assume the capital expenditure required for Booking to maintain its market position is the same as depreciation and amortization. The two adjustments net to zero.
Appendix B - Operating Invested Capital
Operating invested capital is used to understand who funds the day-to-day operations of the business. By netting the operating assets against the operating liabilities of Booking Holdings, we get -$4.6B. This tells us that the operations of the business are funded by the suppliers, merchants and customers, plus extra (float). Shareholders and lenders are not needed to finance operations. Goodwill is included in the calculation because it represents the premium paid for acquisitions over the assessed value of the tangible assets. Including it helps quantify management’s capital allocation ability. In this case, the operating invested capital is negative regardless of whether goodwill is included or not.
Operating Invested Capital, December 31, 202525
| Component | Item | $m |
|---|---|---|
| Operating assets | Receivables | 3,820 |
| Prepaid | 611 | |
| Other current | 630 | |
| PP&E | 807 | |
| Lease assets | 632 | |
| Intangibles | 918 | |
| Goodwill | 2,669 | |
| Other assets | 1,392 | |
| Total operating assets | 11,479 | |
| Operating liabilities | Payables | (5,094) |
| Accrued | (4,454) | |
| Deferred merchant bookings | (5,270) | |
| Other long-term liabilities | (714) | |
| Lease liabilities | (557) | |
| Total operating liabilities | (16,089) | |
| Operating invested capital | At 31 Dec 2025 | (4,610) |
Footnotes
-
https://www.sec.gov/Archives/edgar/data/1075531/000107553126000009/bkng-20251231.htm#i520d0de07f6b49c5b84e7212c6cc1842_16, pg. 1 ↩
-
https://www.sec.gov/Archives/edgar/data/1075531/000107553126000009/bkng-20251231.htm#i520d0de07f6b49c5b84e7212c6cc1842_16, pg. 2 ↩
-
https://www.sec.gov/Archives/edgar/data/1075531/000107553126000009/bkng-20251231.htm#i520d0de07f6b49c5b84e7212c6cc1842_16, pg. 31 ↩
-
Financial Modelling Prep API & 10-k filings across years presented. ↩ ↩2
-
https://skift.com/oral-history-of-booking-acquisition/ ↩ ↩2 ↩3 ↩4 ↩5
-
https://merchantadvisory.com/qa-with-ajay-moti-at-booking-com/ ↩
-
https://www.sec.gov/Archives/edgar/data/1075531/000107553126000009/bkng-20251231.htm#i520d0de07f6b49c5b84e7212c6cc1842_16, pg. 26 ↩
-
Financial Modeling Prep API, FMP:statements income-statement (BKNG, annual 10y). Interest income (interestIncome field), FY2017 to FY2025. ↩
-
https://www.sec.gov/Archives/edgar/data/1075531/000107553126000009/bkng-20251231.htm#i520d0de07f6b49c5b84e7212c6cc1842_16, pg. 6 ↩
-
https://s25.q4cdn.com/383369491/files/doc_financials/2026/q2/BKNG-Quarterly-Earnings-Presentation-Q2-2026.pdf, pg. 5 ↩ ↩2
-
Financial Modeling Prep API, FMP:statements income-statement (annual 10y; quarterly 6q). Revenue, operating income, interest, tax, net income. ↩
-
https://www.sec.gov/Archives/edgar/data/1075531/000107553126000036/q2-26bkngearningsrelease.htm, pg. 15 ↩
-
https://www.sec.gov/Archives/edgar/data/1075531/000107553126000036/q2-26bkngearningsrelease.htm, pg. 11 ↩
-
Financial Modeling Prep API, FMP:statements cashflow-statement (annual 10y; quarterly 22q). CFO, capex, SBC, working capital, buybacks, dividends. ↩
-
Financial Modeling Prep API, FMP:statements key-metrics (annual 10y). ROIC, invested capital, EV, market cap, SBC/revenue. ↩
-
Financial Modeling Prep API, FMP:statements owner-earnings (quarterly, Q1 2014 to Q2 2026), cashflow-statement (annual 12y), income-statement (annual 12y). Owner earnings, maintenance and growth capex, operating cash flow, stock comp, net income, diluted weighted average shares, diluted EPS. ↩
-
Financial Modeling Prep API, FMP:statements income-statement (annual, symbol BKNG, FY2016, filed 2017-02-27). Weighted average diluted shares outstanding (weightedAverageShsOutDil), diluted EPS (epsDiluted), net income. ↩
-
Financial Modeling Prep API, FMP:statements income-statement (quarterly, symbol BKNG, Q2 2026, period ended 2026-06-30, filed 2026-08-04). Weighted average diluted shares outstanding (weightedAverageShsOutDil), diluted EPS (epsDiluted), net income. ↩
-
https://www.sec.gov/Archives/edgar/data/1075531/000107553126000009/bkng-20251231.htm#i520d0de07f6b49c5b84e7212c6cc1842_127, 25 ↩
-
https://docs.google.com/spreadsheets/d/1nigCgAQxhfQYFgO7u8b-Y0XwWfLjkDBaPdiE7gOUczo/edit?gid=750805656#gid=750805656 ↩
-
https://www.sec.gov/Archives/edgar/data/1075531/000107553126000009/bkng-20251231.htm#i520d0de07f6b49c5b84e7212c6cc1842_127, pg. 25 ↩
-
https://www.sec.gov/Archives/edgar/data/1075531/000107553126000009/bkng-20251231.htm#i520d0de07f6b49c5b84e7212c6cc1842_127, pg. 26 ↩
-
https://docs.google.com/spreadsheets/d/1nigCgAQxhfQYFgO7u8b-Y0XwWfLjkDBaPdiE7gOUczo/edit?gid=130839315#gid=130839315 ↩
-
https://www.sec.gov/Archives/edgar/data/1075531/000107553126000009/bkng-20251231.htm#i520d0de07f6b49c5b84e7212c6cc1842_115, pg. 52 ↩